tastytrade Backtesting, Tested: What It Does and Where It Breaks
We tested tastytrade's free backtester: a fine first pass on whether a structure makes sense, blind to anything intraday. What it does, where it breaks, and the same backtest rerun with modeled fills.
You can backtest options on tastytrade, it's free with an account, and it's worth using for exactly one job: a first pass on whether a structure makes sense on an underlying. It runs on daily data with mid-price fills, so it cannot see anything that happens inside a trading day, and 0DTE isn't on the menu at all.
That's the review in two sentences. The rest is what we found actually using it, including what happened when we reran one of its backtests on minute data with realistic fills and watched the trade list itself change.
What tastytrade's backtester does
The tool lives inside the platform at no extra cost, and the feature set is broader than people assume. At launch it covered 137 stocks and ETFs (SPY, QQQ, AAPL, TSLA, GLD, the usual liquid names), with more added since. Historical data runs about 13 years, back to roughly 2013. No futures options, and the vendor's own copy describes the universe as stocks and ETFs, which as far as we can tell means no index options either.
Structures are genuinely flexible: single calls and puts including naked shorts, verticals, strangles, iron condors, and custom multi-leg combinations. A 2025 update made strike selection respectable, by delta, by percent out-of-the-money, by a fixed price offset, or by a premium target. Exits can trigger on profit percent, loss percent, a DTE threshold, or days in trade. Plenty of paid backtesters box you into fewer structures than this.
Tested: where it holds up
We gave it a simple long-premium program: buy the 50-delta QQQ call, target 90 DTE, take profit at 15% of the debit, one position at a time, re-enter when flat. Setup took about two minutes, strike selection by delta worked as advertised, and results came back fast with a trade list you can actually read.
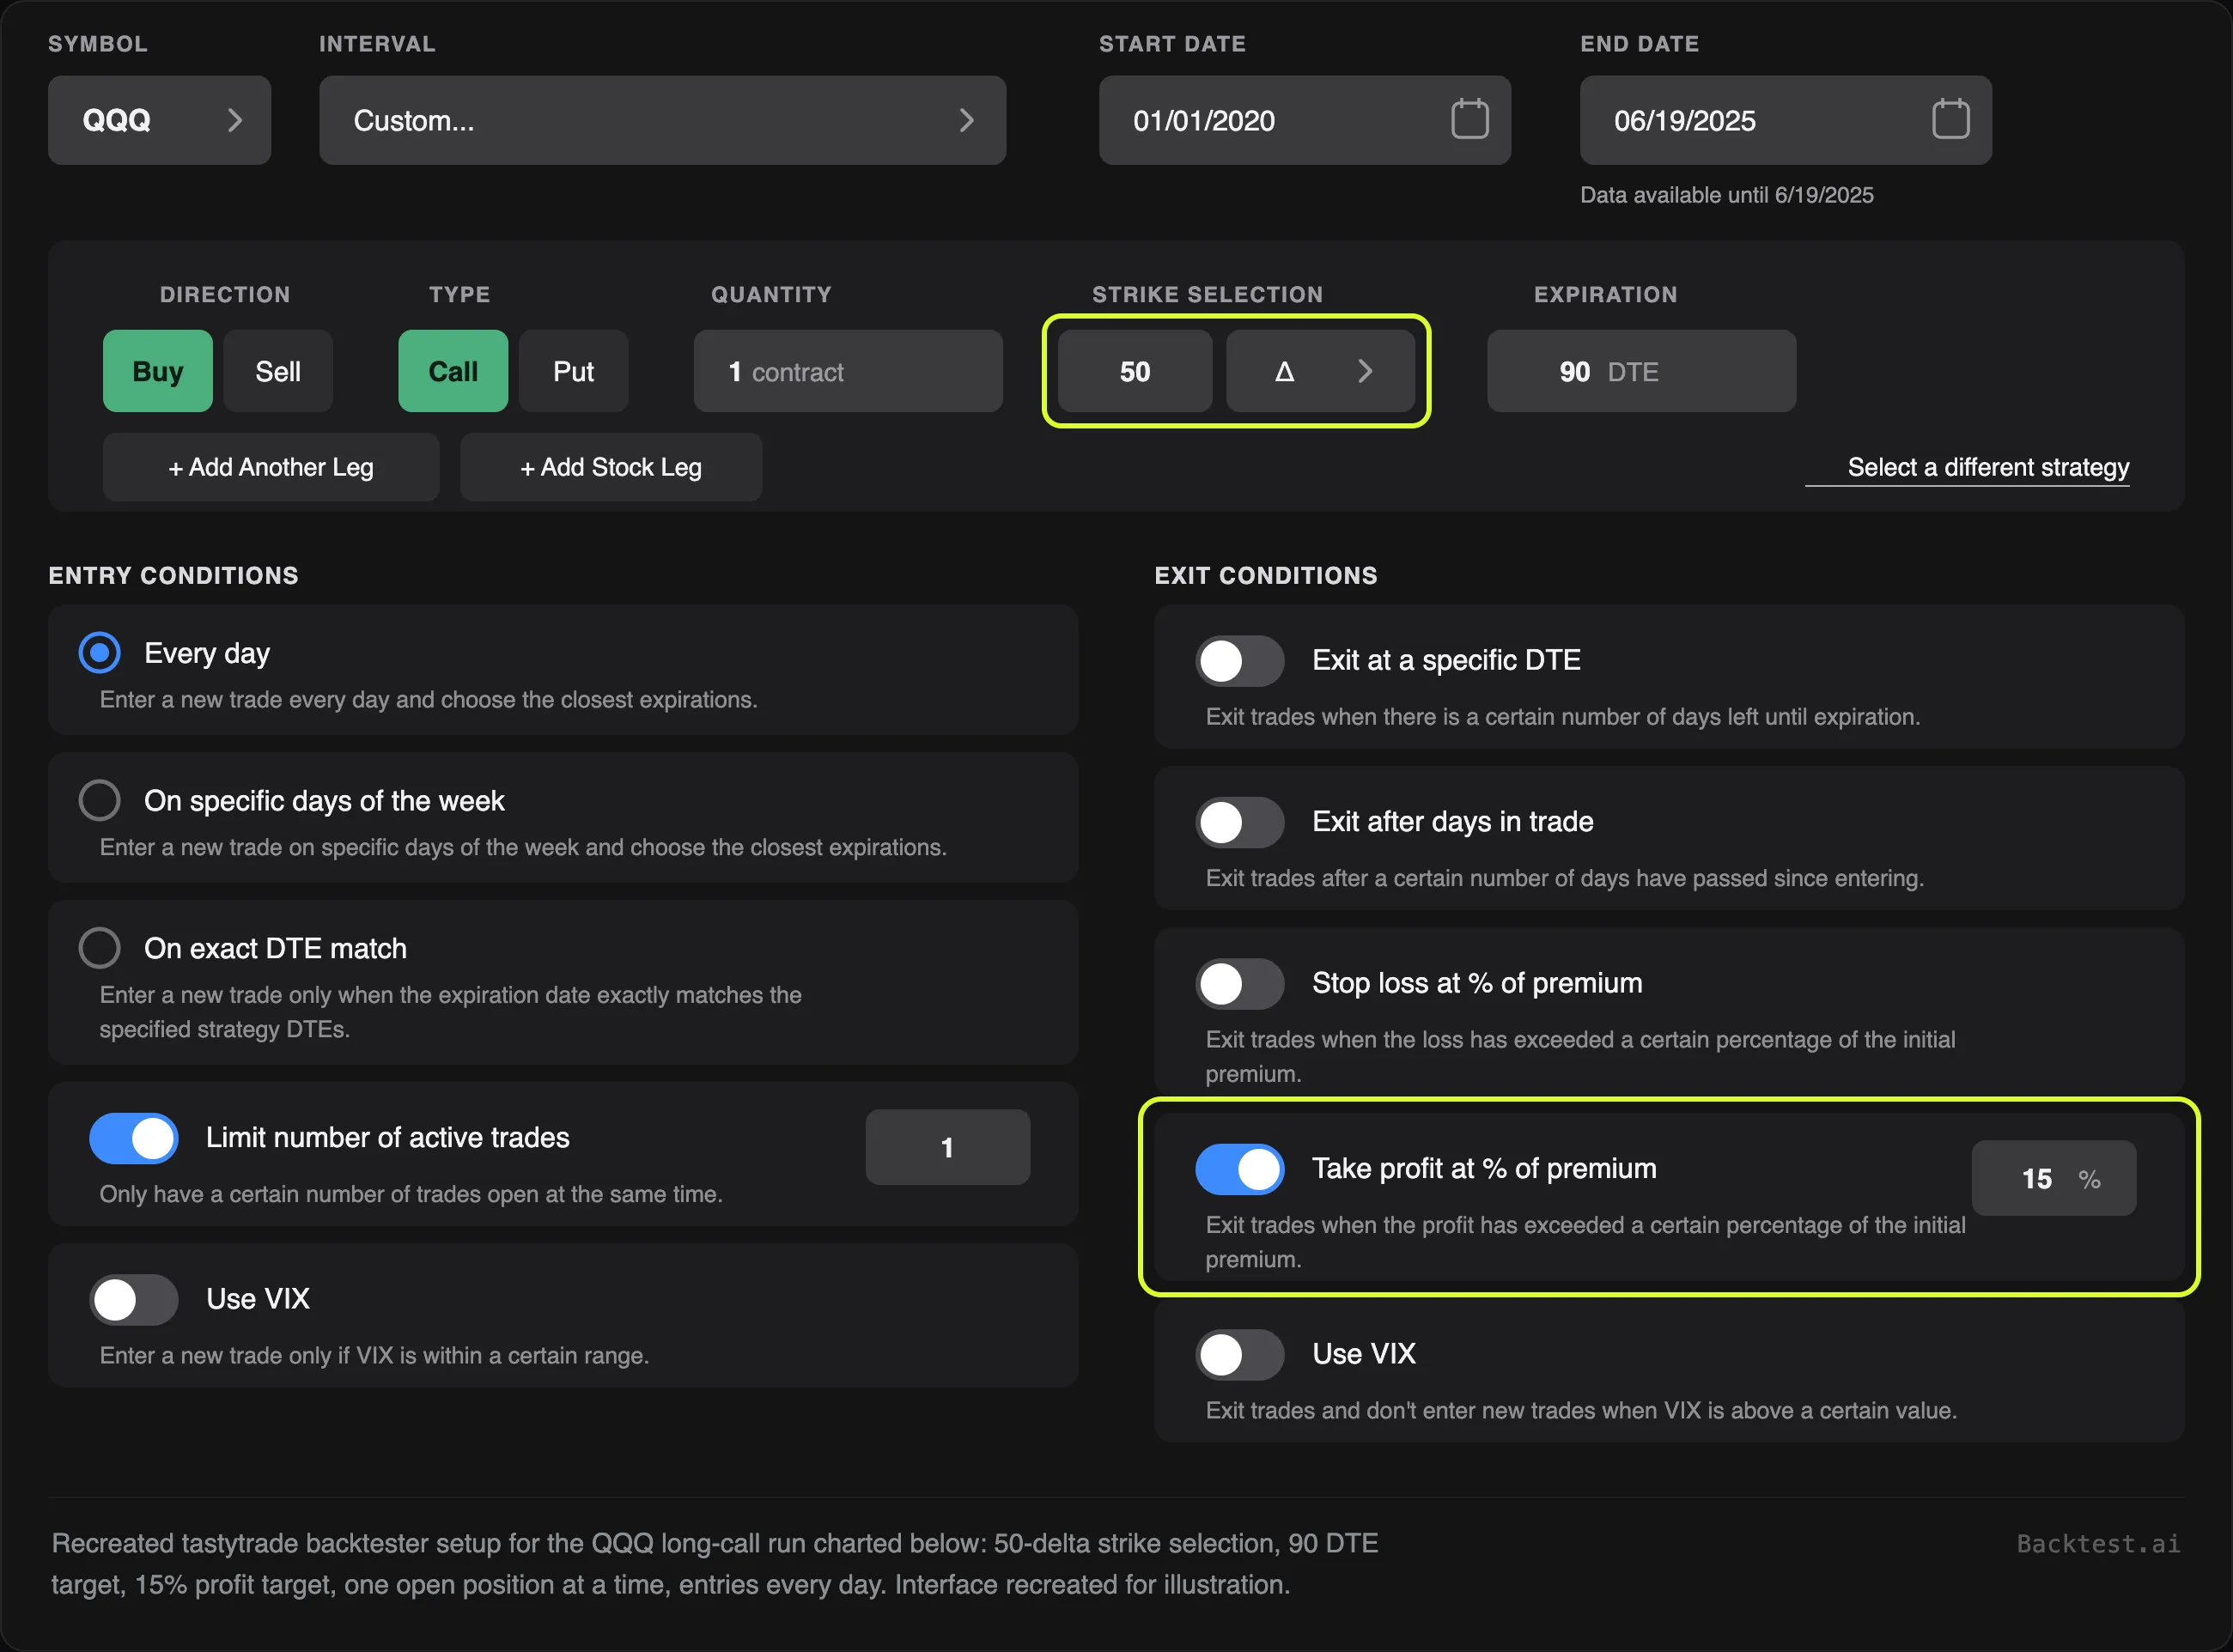
For the question "does buying calls on QQQ with a quick profit target even make sense as a shape," the tool gives you a free, fast reading. That's the job it was built for, and it does it.
One setup detail to know about: the "Use exact DTE" toggle. We left it off, which lets the tool pick a nearby listed expiration instead of insisting on 90 days, and the entries it took ranged from 90 to 169 DTE, median 100. That's the toggle doing its job, not the tool misbehaving. But a five-and-a-half-month call is a different trade than a three-month one, so read the trade list to see which strategy you actually tested. To reproduce the same entry stream on our engine, we allowed expirations up to 60 days past target.
Tested: where it breaks
The pattern in everything below: the specs that most decide what a backtest means are exactly the ones tastytrade doesn't publish. Resolution, fills, and margin all had to come from our own poking. Our options backtesting guide covers why those three dimensions carry so much weight; here's how each one shows up in this tool.
Daily bars
Our hands-on testing puts the data at daily resolution. Not documented, anywhere.
Daily data is a security camera that keeps one frame per day, taken at the close. Whatever happened between frames is not in the film. A stop-loss percent evaluated on daily marks can't tell you whether you'd have been stopped at 10:15 and watched the recovery from the sidelines. A profit target gets checked once per session. And 0DTE simply isn't offered: there is no expiration to select, and daily bars couldn't adjudicate a trade that lives and dies inside one of them anyway.
If your strategy touches an intraday stop, an entry clock, or anything expiring same-day, this tool has no opinion. Not a rough one. None.
Mid-price fills, and no way to change them
There is no slippage setting, no fill model menu, no commissions input. Nothing in the results discloses the fill assumption either; our testing says orders mark at the mid of the quoted spread. Mid fills flatter every result, because live orders don't get to buy at the midpoint every time, and the flattery scales with how wide the spread is relative to your edge.
Margin you can't check
The tool sizes positions against some capital requirement, and nothing on screen says which one. Our read is Reg-T, possibly with house buying-power rules on top. The critique here is opacity rather than absence: you can't confirm whether the sizing your backtest used would be legal in your actual account.
What it can't see at all
No point-in-time event data, so you can't gate entries around earnings or FOMC honestly. No custom signals. No walk-forward, no out-of-sample split, no validation of any kind. It answers "what did this template return over this window" and nothing upstream or downstream of that question.
For software that informs money decisions, undocumented assumptions are themselves an answer. A vendor that models fills honestly usually tells you so.
The same backtest, two sets of assumptions
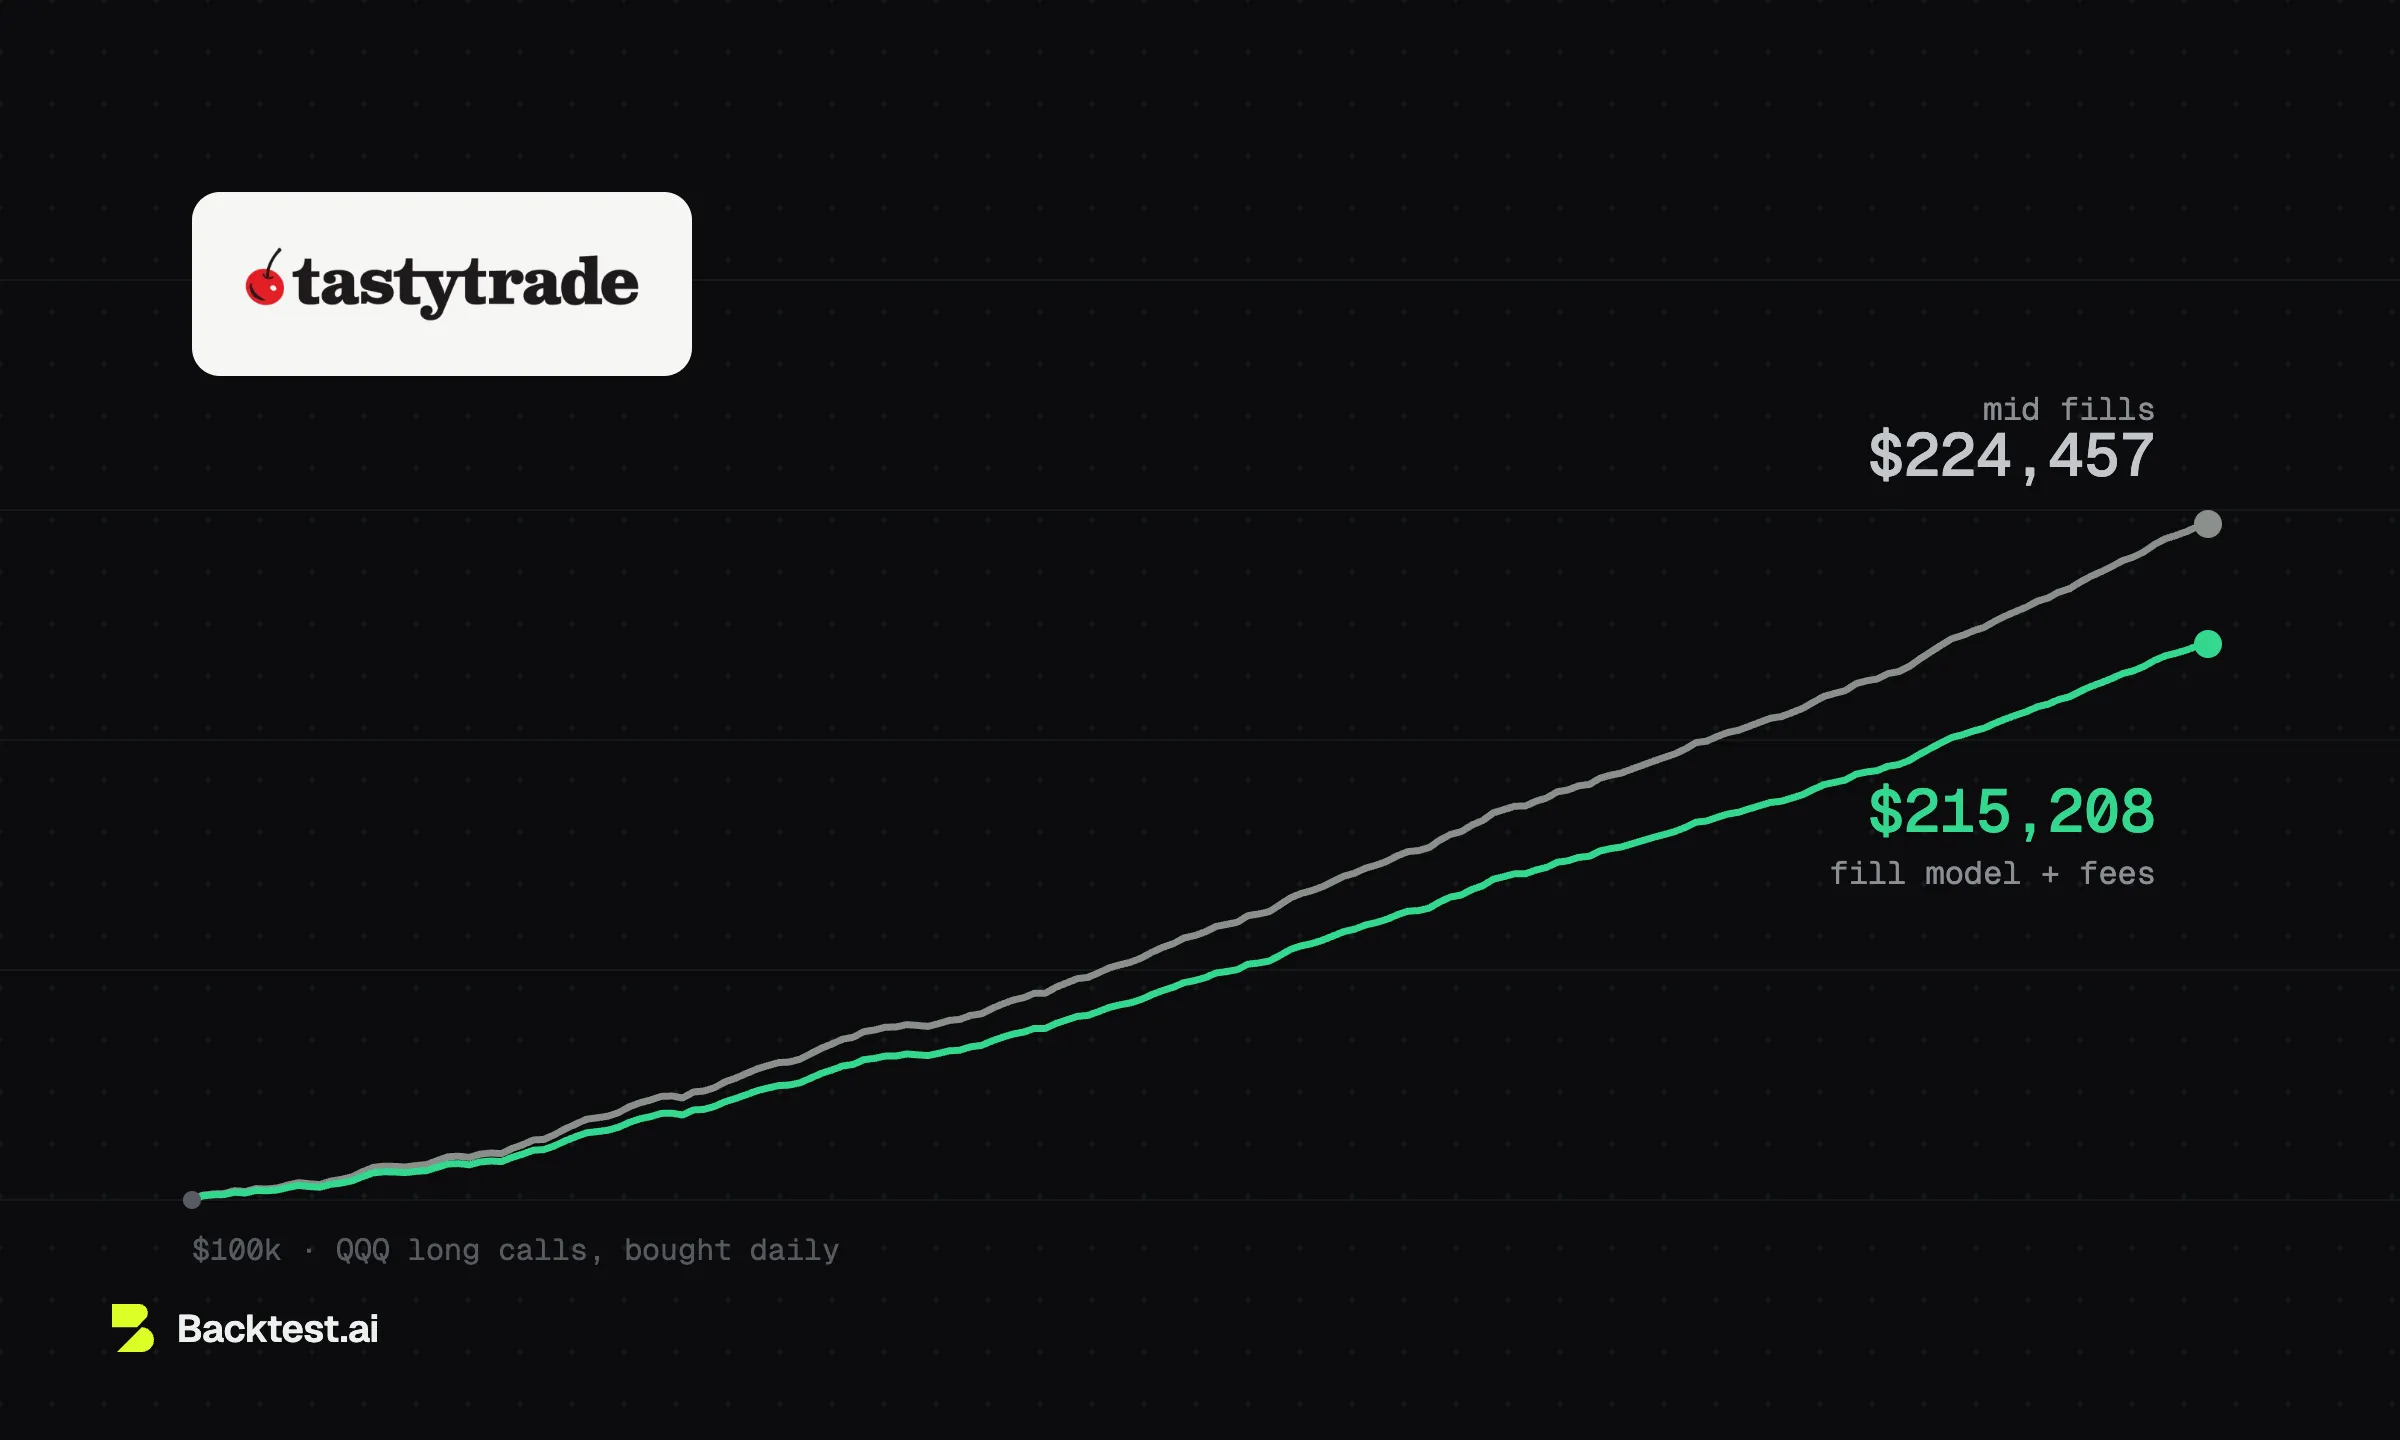
Here's what those assumptions are worth in practice. We ran the QQQ call program two ways: once in tastytrade's backtester, and once rebuilt on our engine, on minute NBBO data with the fill model calibrated on NBBO quotes and trades, $0.65 per contract per side in fees, and entries pinned at 15:45 ET to line up with the daily tool's end-of-day marks. Same rules, same January 2020 through June 2025 window, same $100k start.

Same strategy definition, same window, two sets of modeling assumptions. Methodology comparison, not a performance claim.
Read the edge row first: $101 against $102, a tie inside the noise. This configuration is close to the best case for mid fills, a single leg carrying a roughly $2,000 debit, a quoted spread measured in cents, holds of about six days. Realistic fills and fees cost about $11 per contract round trip, and in this window later exits in a mostly rising market happened to claw that back. That's regime luck, not a free lunch; in chop the same delayed exits pay the toll twice.
Now read everything else. Of the 96 entry dates the two runs share, 11 exited on a different day outright, and nearly every shared trade printed different fills. Fifteen trades exist only in tastytrade's list and eleven only in ours, because different exits cascade into a different entry stream. The realistic run completed four fewer trades and sized slightly smaller the whole way, and finished $9,249 lighter, 7.4% less profit. On this strategy, fills didn't tax the average trade. They taxed the compounding.
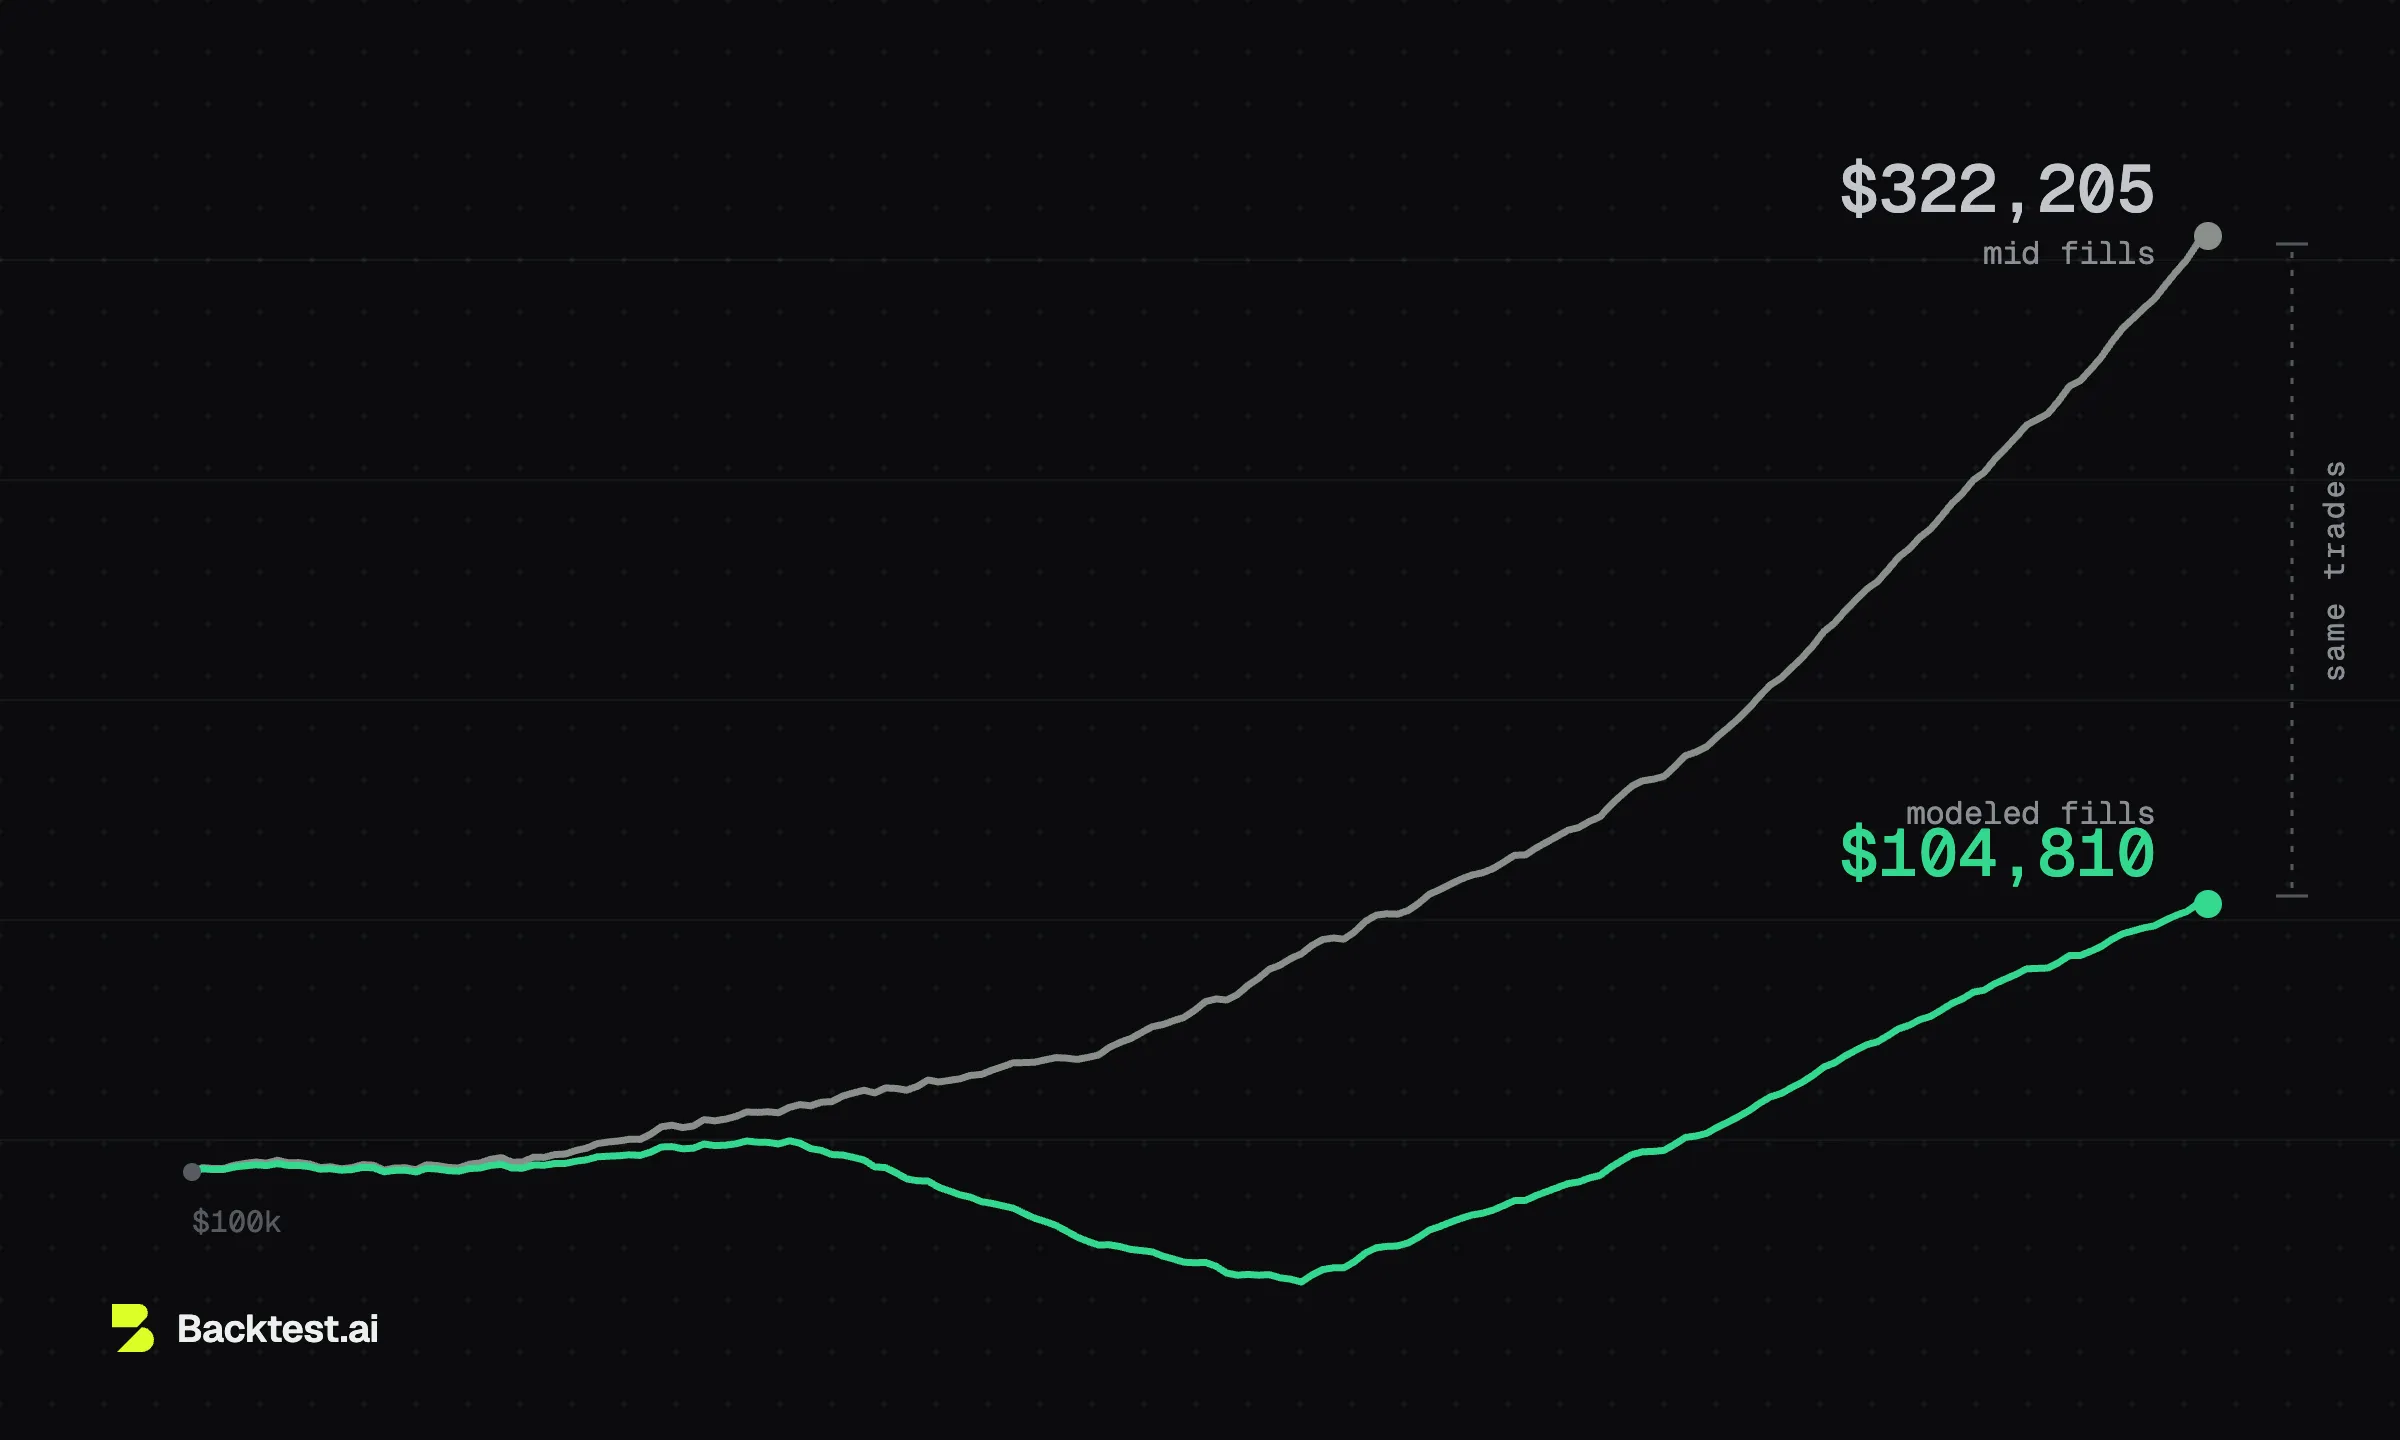
And this was the gentle case. Run the same contrast on a four-leg 0DTE structure, where the edge per trade is a fraction of the spread, and the fill model stops being a tax and becomes the result: in our guide's condor experiment, the same 876 trades returned 222% at mid and 4.8% through the fill model. The faster and more multi-legged your trading, the more the fill assumption is the backtest.
One more thing both runs agree on, worth more than the fill story. This program wins 92.8% of the time, and its average loser is 7 times its average winner per contract. Seven of the eight losers were calls held to expiration and worth exactly nothing [the eighth kept about a tenth of its debit]. Three of the six calendar years came out flat to negative, carried by the other three. tastytrade's results screen leads with the win rate. It has no construct for asking whether the entry has any predictive content, or whether a 7-to-1 tail behind a 93% hit rate is a shape you can live with.
How to work around the limits
Inside its lane, the tool is honest enough. Stay there:
- Test only what daily marks can see. Multi-day structures, exits by DTE or profit percent, no intraday logic. A 45 DTE spread managed at 21 DTE qualifies. Anything with a tight stop doesn't.
- Treat every result as an upper bound. Mid fills and zero fees only err in one direction.
- Read the trade list, not the headline. Check the actual entry DTEs against what you asked for, weigh the average loser against the average winner, and see which years carried the curve.
- Don't test event-driven ideas. The tool can't see earnings or FOMC, so it can't honestly avoid them.
You've outgrown it the day your strategy needs any of: an intraday stop or entry time, an expiration the same week, a signal gating entries, sizing against margin you can verify, or out-of-sample evidence that the edge is real. What handles those questions is covered in our best options backtesting software guide, and the fill and margin mechanics are documented in how we model fills and margin. We're running the same exercise on thinkorswim backtesting and tradingview backtesting.
The data-depth point
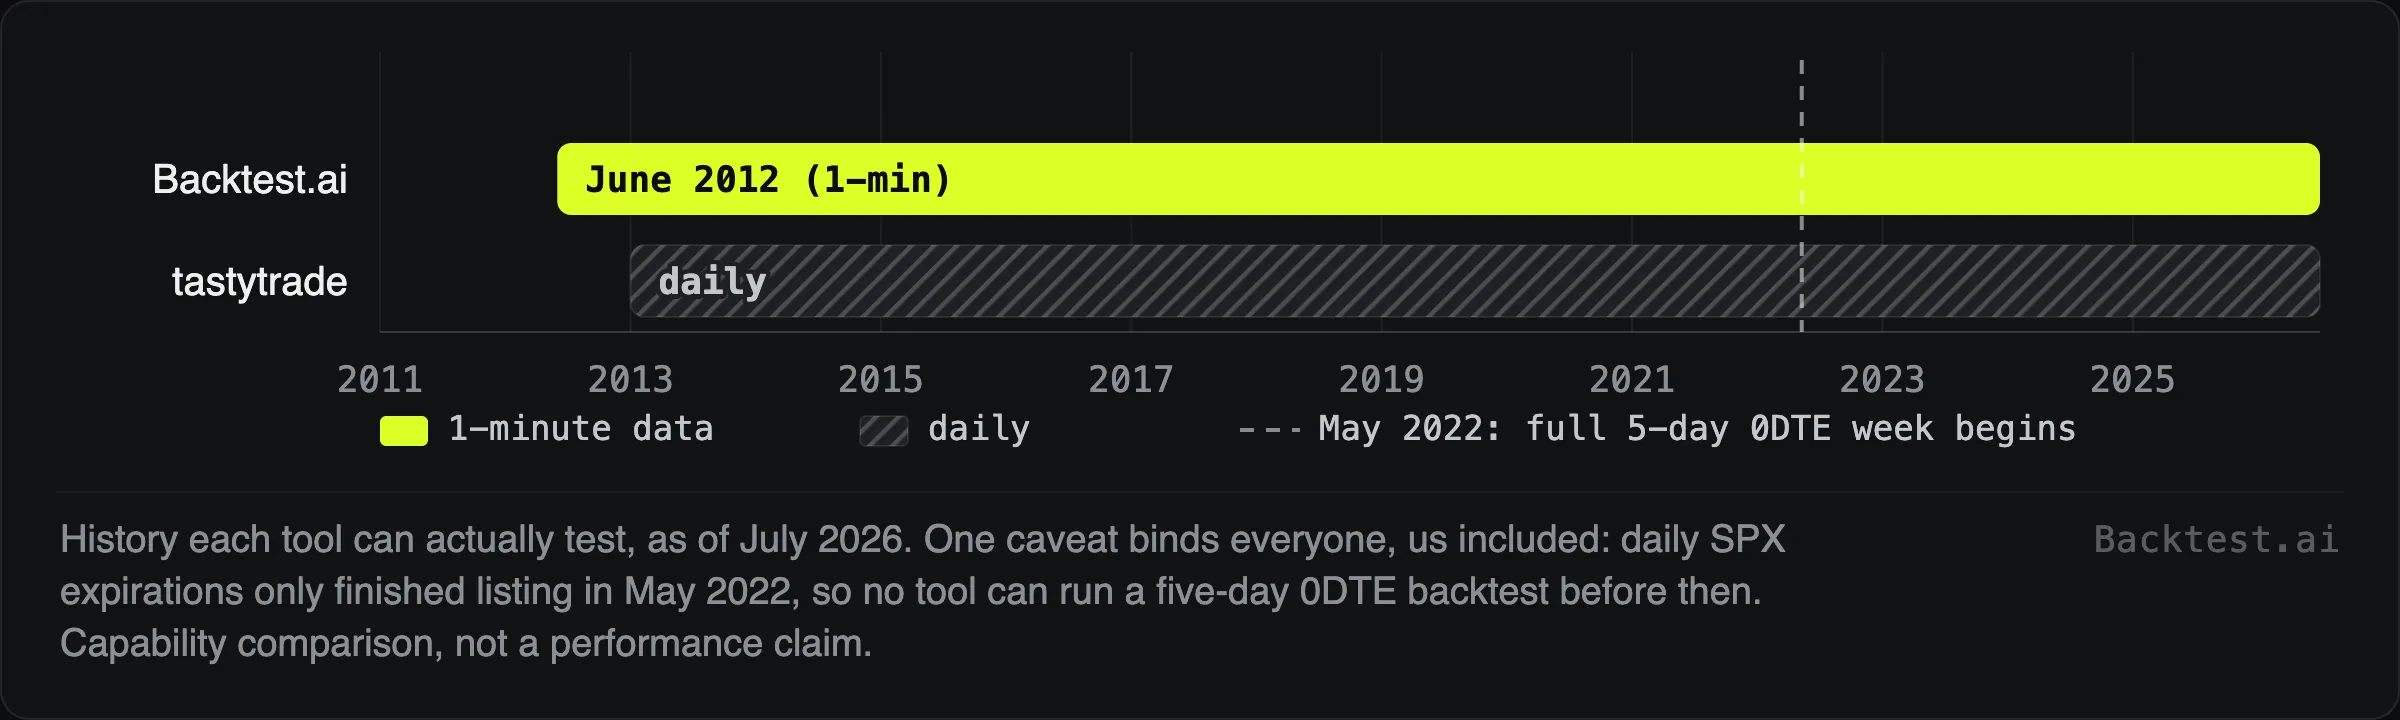
tastytrade's history reaches to roughly 2013, which sounds comparable to anyone's until you remember it's daily. Minute-resolution history back to June 2012 exists so a multi-day strategy has to face 2015, 2018, 2020, and 2022 with its stops and targets evaluated at the cadence they'd actually trigger. Depth and resolution multiply: thirteen years of daily bars is about 3,270 frames of film, and the same window at minute resolution is over 1.2 million.
tastytrade backtesting FAQ
Can you backtest options on tastytrade?
Yes. The platform includes a free backtester covering 137+ stocks and ETFs with about 13 years of history, testing single legs through custom multi-leg structures with delta-based strike selection and exits by profit percent, loss percent, DTE, or days in trade.
Is tastytrade's backtester free?
Yes, with a tastytrade account. There's no separate subscription or tier.
How far back does tastytrade's backtesting data go?
About 13 years, to roughly 2013, at daily resolution. The resolution isn't documented by tastytrade; daily is what our hands-on testing shows.
Can you backtest 0DTE on tastytrade?
No. Same-day expirations aren't offered, and the daily data couldn't evaluate a trade that opens and closes inside one bar anyway. Note that no platform can backtest a full 0DTE week before May 2022, when daily SPX expirations finished listing.
How accurate are tastytrade's backtest fills?
Orders appear to fill at the mid of the quoted spread, with no slippage or fee modeling and no setting to change it. What that costs depends on the strategy: in our contrast run on a 90 DTE QQQ call it was about $11 per contract round trip against a $101 per-contract edge, and the gap widens fast as spreads get wider relative to the edge, or legs multiply, or holds shorten.
Backtest.ai is analysis and automation software. Nothing on this page is investment advice or a promise of trading results. Simulated results above are illustrations of how modeling assumptions change backtest output, and backtested performance never guarantees live performance, on any platform, including ours.

Research notes from Liam, building Backtest.ai: the methodology, the data, and the experiments behind the platform.
Keep reading
Options Backtesting: A Practical Guide for Systematic Traders
The same 0DTE iron condor, backtested twice: +222% with mid fills, +4.8% through a calibrated fill model. How to run an options backtest that doesn't flatter you — data, fills, margin, and validation.
Walk-Forward Analysis: How to Validate and Optimize Trading Strategies
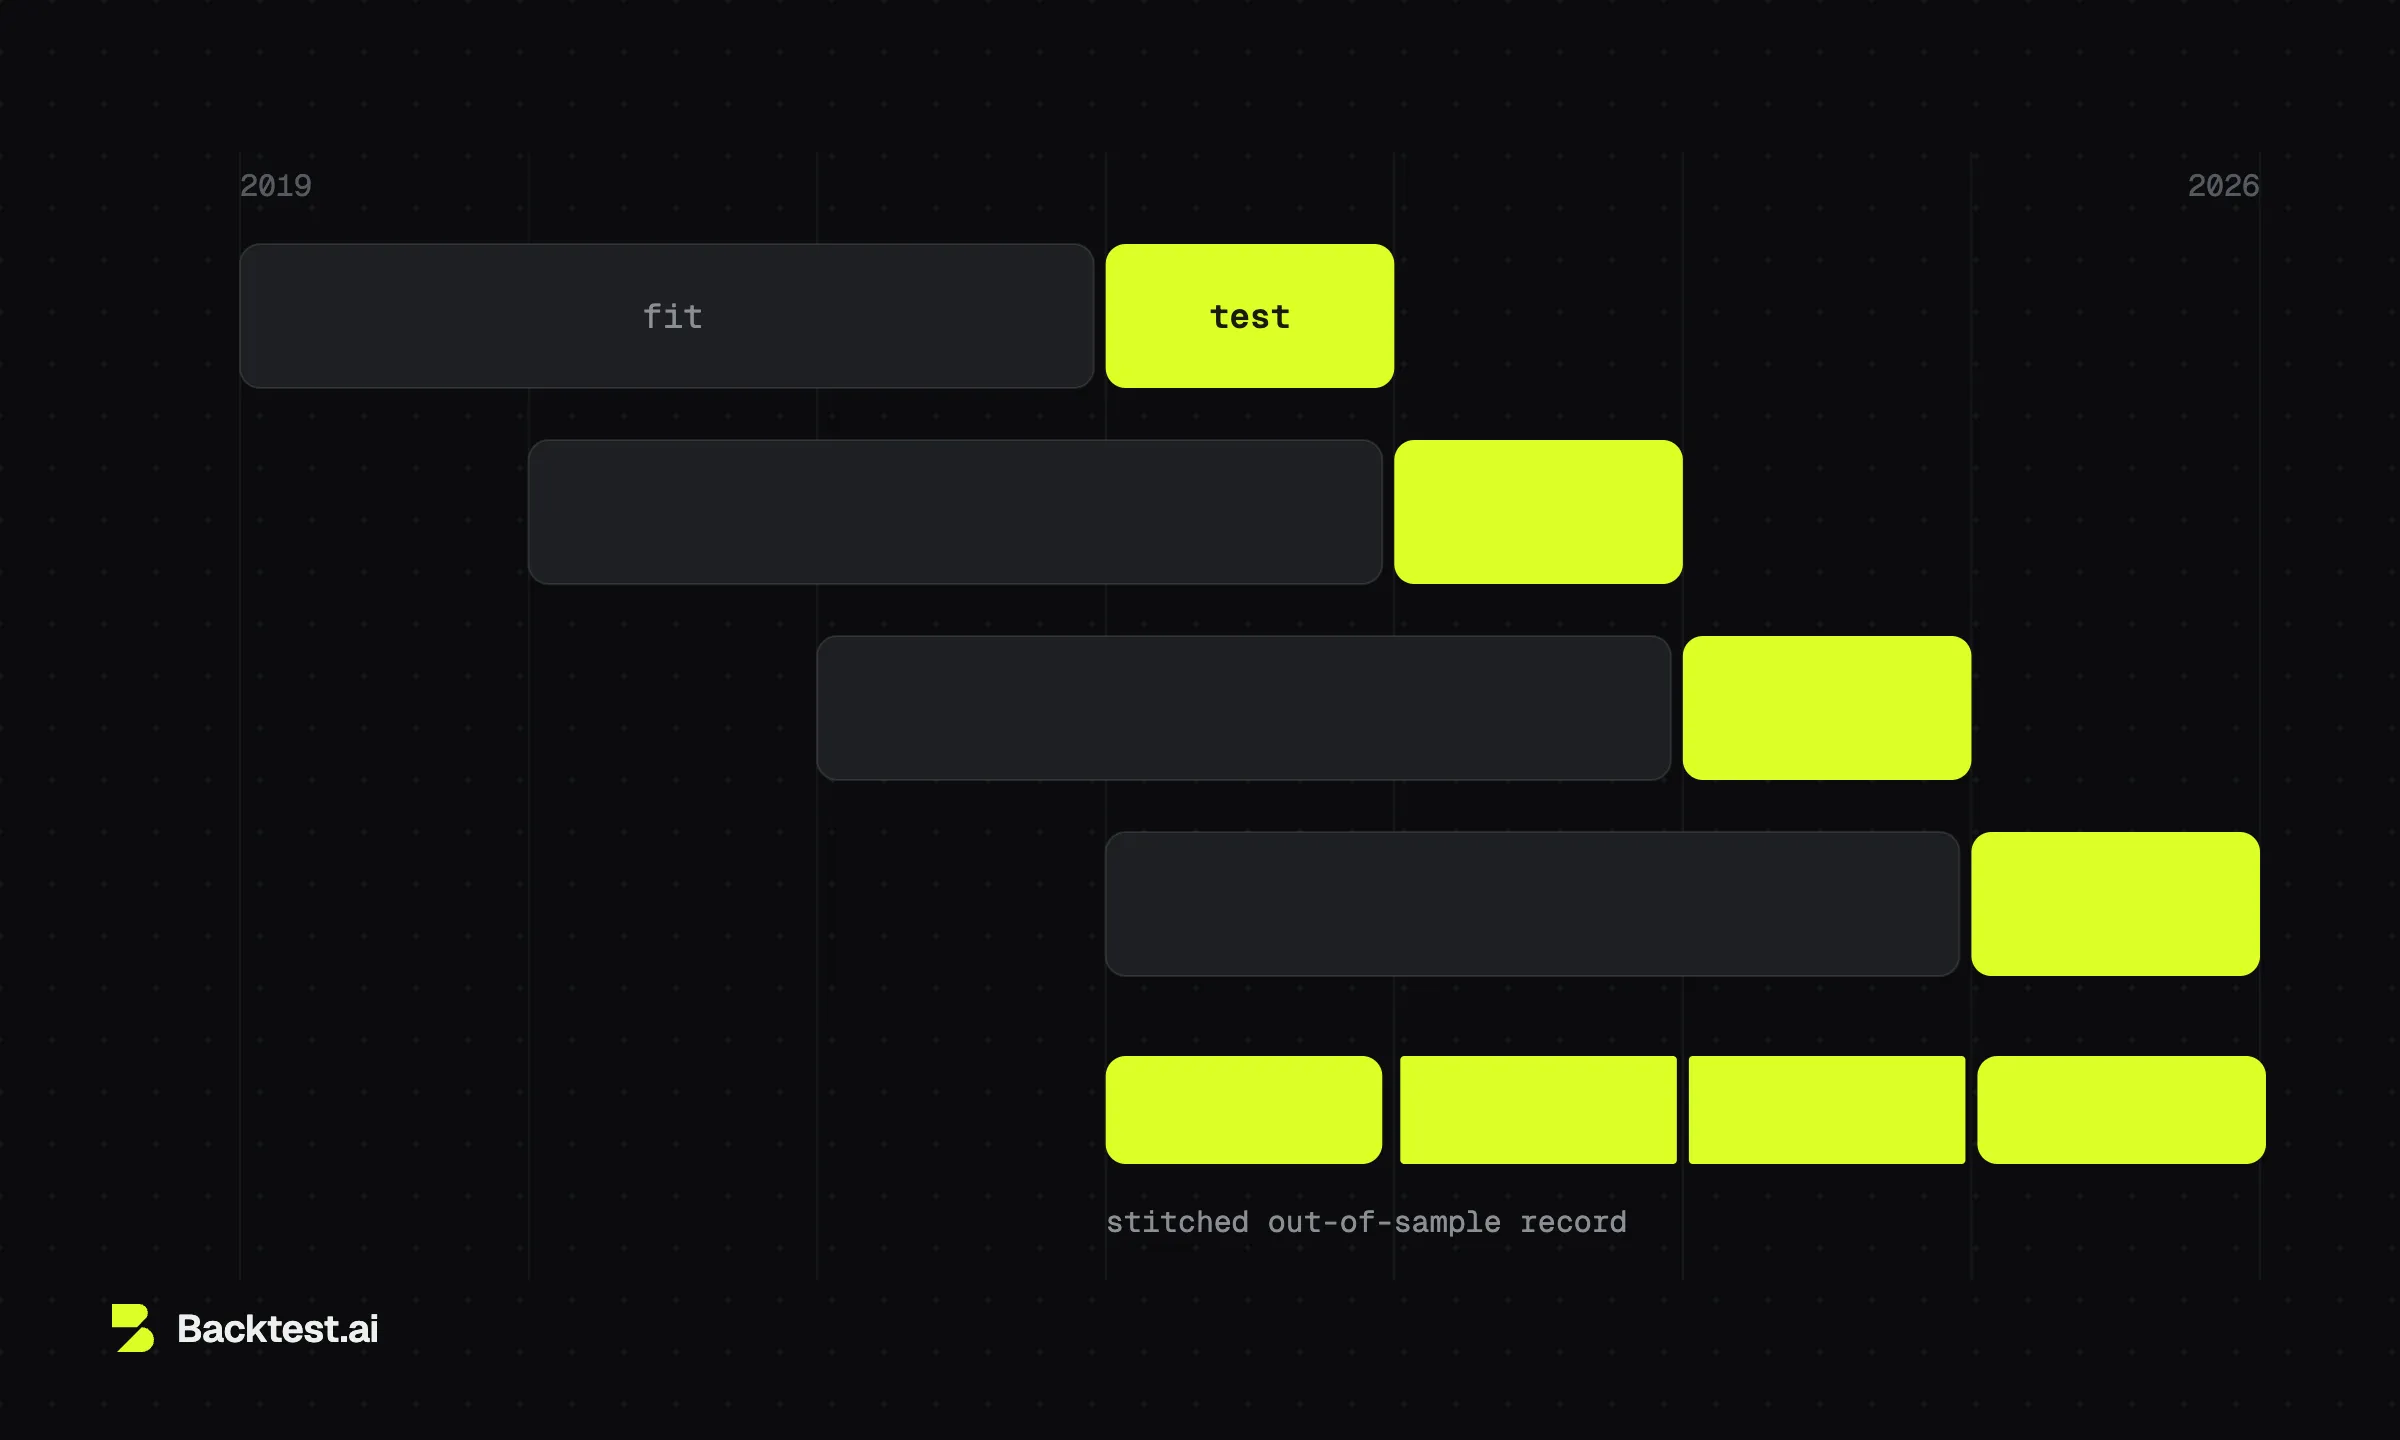
Fit on one window, test on the unseen window after it, roll forward. What walk-forward analysis buys you over a single train/test split, and how to read a real fold table — including one that failed.