Options Backtesting: A Practical Guide for Systematic Traders
The same 0DTE iron condor, backtested twice: +222% with mid fills, +4.8% through a calibrated fill model. How to run an options backtest that doesn't flatter you — data, fills, margin, and validation.
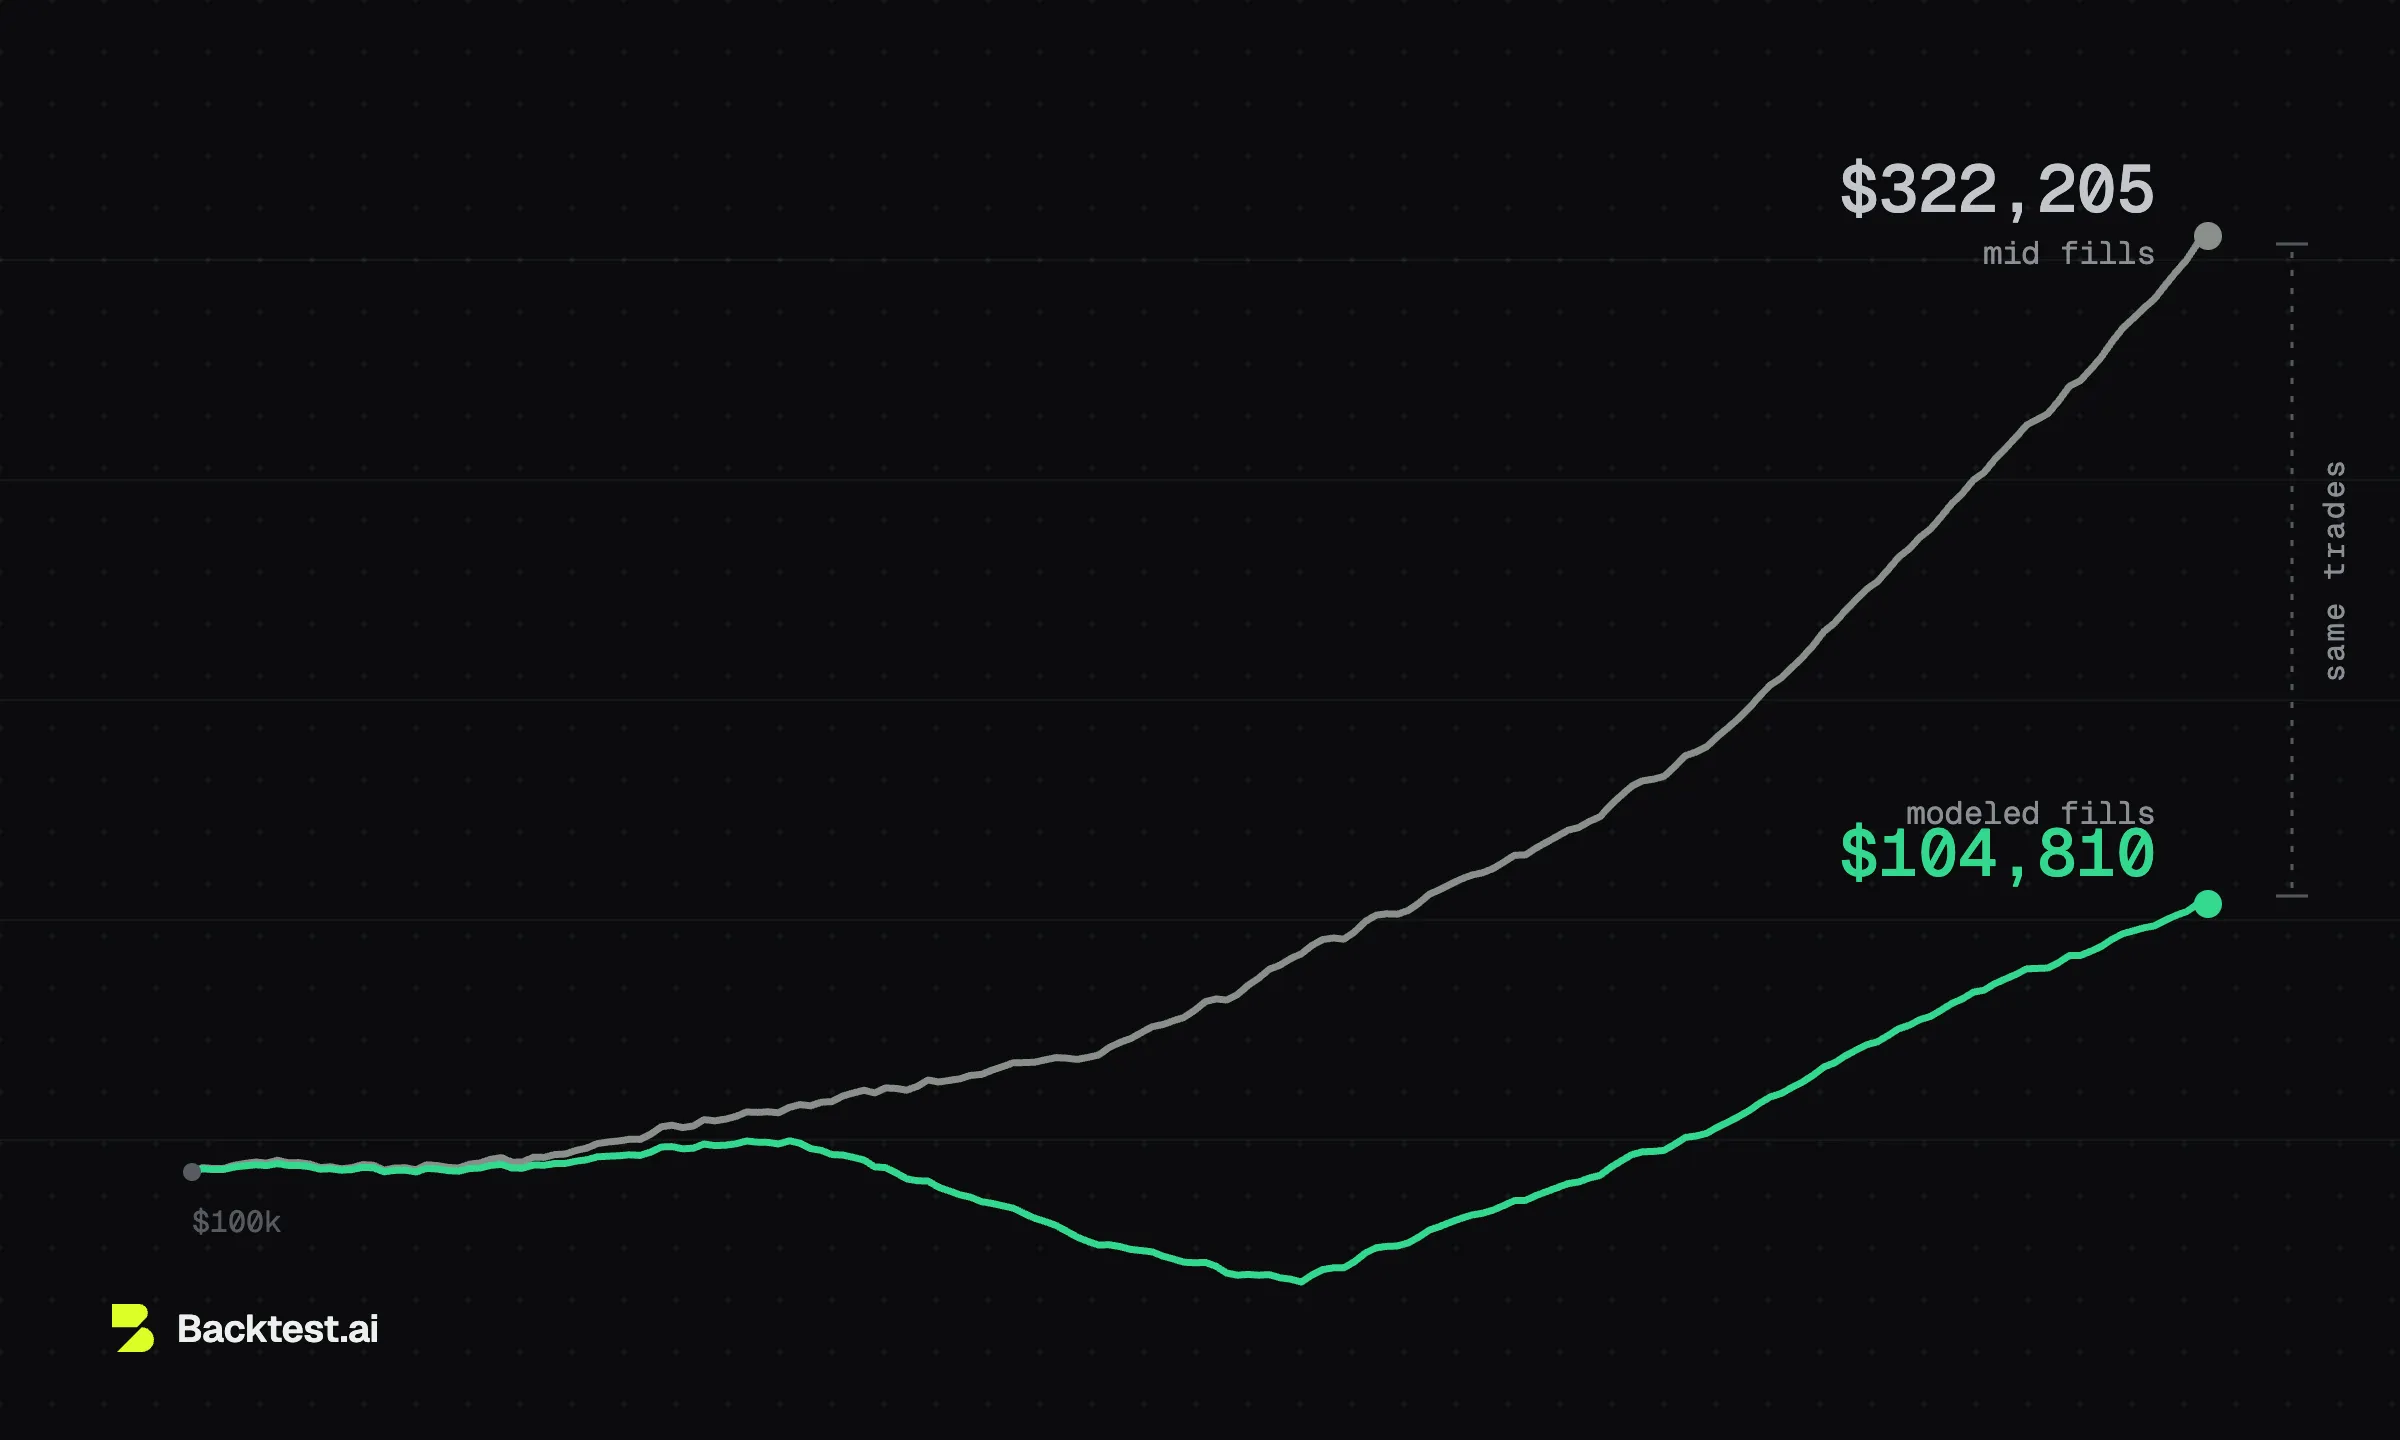
Options backtesting means testing an options strategy's rules against historical chain data, the quotes, greeks, and expirations as they actually printed, to see how the strategy would have behaved. It differs from backtesting stocks in one important way: option results are shaped by bid-ask spreads, expiration mechanics, and margin, so the simulation's assumptions carry as much weight as the strategy's rules.
We ran the same backtest twice. Same 0DTE iron condor, same 876 trades, same entry clock, same sizing rule, three and a half years of SPX minute data. The first run finished up 222%. The second finished up 4.8%. The only thing that changed between them was the assumption about where orders fill.
That gap between 222% and 4.8% is what an assumption looks like. An options backtest can mislead you in three places, the data window, the fill model, and the margin math, and all three flatter you by default. This guide covers how to run one properly and how to catch all three, with two experiments from our own engine as evidence.
What options backtesting is (and why it's harder than backtesting stocks)
A stock backtest replays one price series. An options backtest replays a market.
Take SPX. On a typical day it lists roughly 400 strikes across two dozen expirations. Sample calls and puts at minute cadence and you're carrying about 7.5 million option-minutes of quotes per day, for one underlying [rough arithmetic: 400 strikes x 24 expirations x 2 sides x 390 minutes]. That scale is why so many tools quietly compromise on resolution, on history, or on both, and why "where does your data come from" is a fair question to ask any backtester.
The second difference: an option's price is a surface, not a line. Value moves with spot, time, and implied volatility together, so a trustworthy simulation replays what the chain actually quoted at that minute. Reconstructing prices from a fitted volatility surface looks cleaner and tests better, because the fitting quietly smooths away the ugly quotes your orders would have traded against.
Third, options results are path-dependent in ways stocks aren't. Contracts expire. Short legs get assigned. Stops trigger inside the minute. A daily bar cannot adjudicate a 0DTE stop; the entire life of the trade happens inside one bar.
The general discipline of backtesting has its own foundations. Everything below is about what options add on top.
How to backtest an options strategy, step by step
1. Write rules a computer could execute
Strike selection by delta, entries by clock, exits by rule, sizing by formula. A complete strategy definition fits in one line: sell the 25-delta SPX put spread, 10 points wide, 30 DTE, enter at 9:45 ET, hold to expiration, size to a 20% fraction of equity.
If a step needs your judgment, you have an opinion, not a testable strategy. Opinions are fine. They just can't be backtested.
2. Match the resolution to the holding period, and the window to the regimes
Minute data for anything that touches intraday logic: 0DTE entries, stop losses, time-based exits. Daily data can be honest for a slow 45-DTE program right up until you add an intraday stop, at which point every bar hides the sequence that decides whether you got stopped.
The window matters just as much and fails more quietly. A strategy tested on one calm year tells you how it behaves in calm years. Below we'll show what that omission costs; the preview is a strategy with a 100% win rate.
3. Model fills, costs, and margin honestly
Mid-price fills are the optimist's default, and most popular options backtesters offer them. Getting four legs filled at mid on a 0DTE chain at 9:46 is a fill that does not exist. Fees look ignorable in isolation, $0.80 per spread round trip in our runs below, until you set them against a per-spread edge of $2.92. And margin decides how big the account could actually have traded: under Reg-T, a defined-risk spread ties up its width minus the credit, whether or not your backtester knows it.
4. Validate. Don't curve-fit
Optimizing parameters on the full history and reporting the winner is how you memorize the past. Prefer parameter plateaus over peaks: a setting whose neighbors also work is a finding, a lone spike is noise. Then run walk-forward analysis: fit on one window, test on the unseen window after it, roll forward, and judge the strategy only on the stitched out-of-sample results. A backtest is the final check on an idea. It's a poor place to go looking for one.
The four steps on one strategy
Here's the whole process run on the strategy from step 1.
The idea comes first, and it has an economic reason to exist before anyone touches data: hedgers pay up for index puts, so selling that insurance with defined risk should collect a premium over time. A premise you can state in advance beats a pattern mined off a screen, because you know what has to stay true for the edge to persist.
The spec is already written: short the 25-delta SPX put, long the put 10 points below it, 30 DTE, entered at 9:45 ET, held to expiration, sized to a 20% fraction of equity.
The modeling demands are mild by options standards. No stop and no intraday exit, so resolution matters less here than it will for anything 0DTE. Fills bite gently, since the spread gets paid twice across a month-long hold. Margin is width minus credit. The window is the decision that actually matters, and we'll let it matter: run it on 2017.
The output: 69 trades, 69 winners. $100,000 compounds to $475,365. Max drawdown -7.1%.
Would you trade it?
Reading the output
Read a backtest in this order, and read win rate last.
Expectancy against the loss tail first. The average winner versus the average loser decides whether a win rate means anything: a strategy that wins nine trades in ten is still ruinous if the average loser hands back five winners' worth. Short-premium strategies buy their win rates on credit, and the tail is the collector.
Trade count second. 69 trades is an anecdote. Expectancy starts meaning something in the hundreds of trades, and only when those trades span more than one kind of market.
Drawdown third, depth and duration both, and check whether a handful of outlier trades are carrying the whole curve.
By that checklist, the 2017 run fails twice before the window question is even asked: the sample is tiny, and the tail never appears in it. Hold your answer to the question above; this exact run comes back below with fourteen years of data.
What makes an options backtest trustworthy
The same three things that let one lie. Here's each, with data.
The fill model: same trades, two verdicts
The experiment. One strategy: a 0DTE SPX iron condor that sells the 25-delta strangle and buys the 5-delta wings as protection, enters at 9:45 ET, exits on a profit target or stop. Median hold: one minute. 876 trades from January 2023 through July 2026, one per session, sized identically in both runs. Run once with mid-price fills and zero costs. Run again through the Backtest.ai fill model, calibrated on NBBO quote and trade data to predict where an order actually fills.
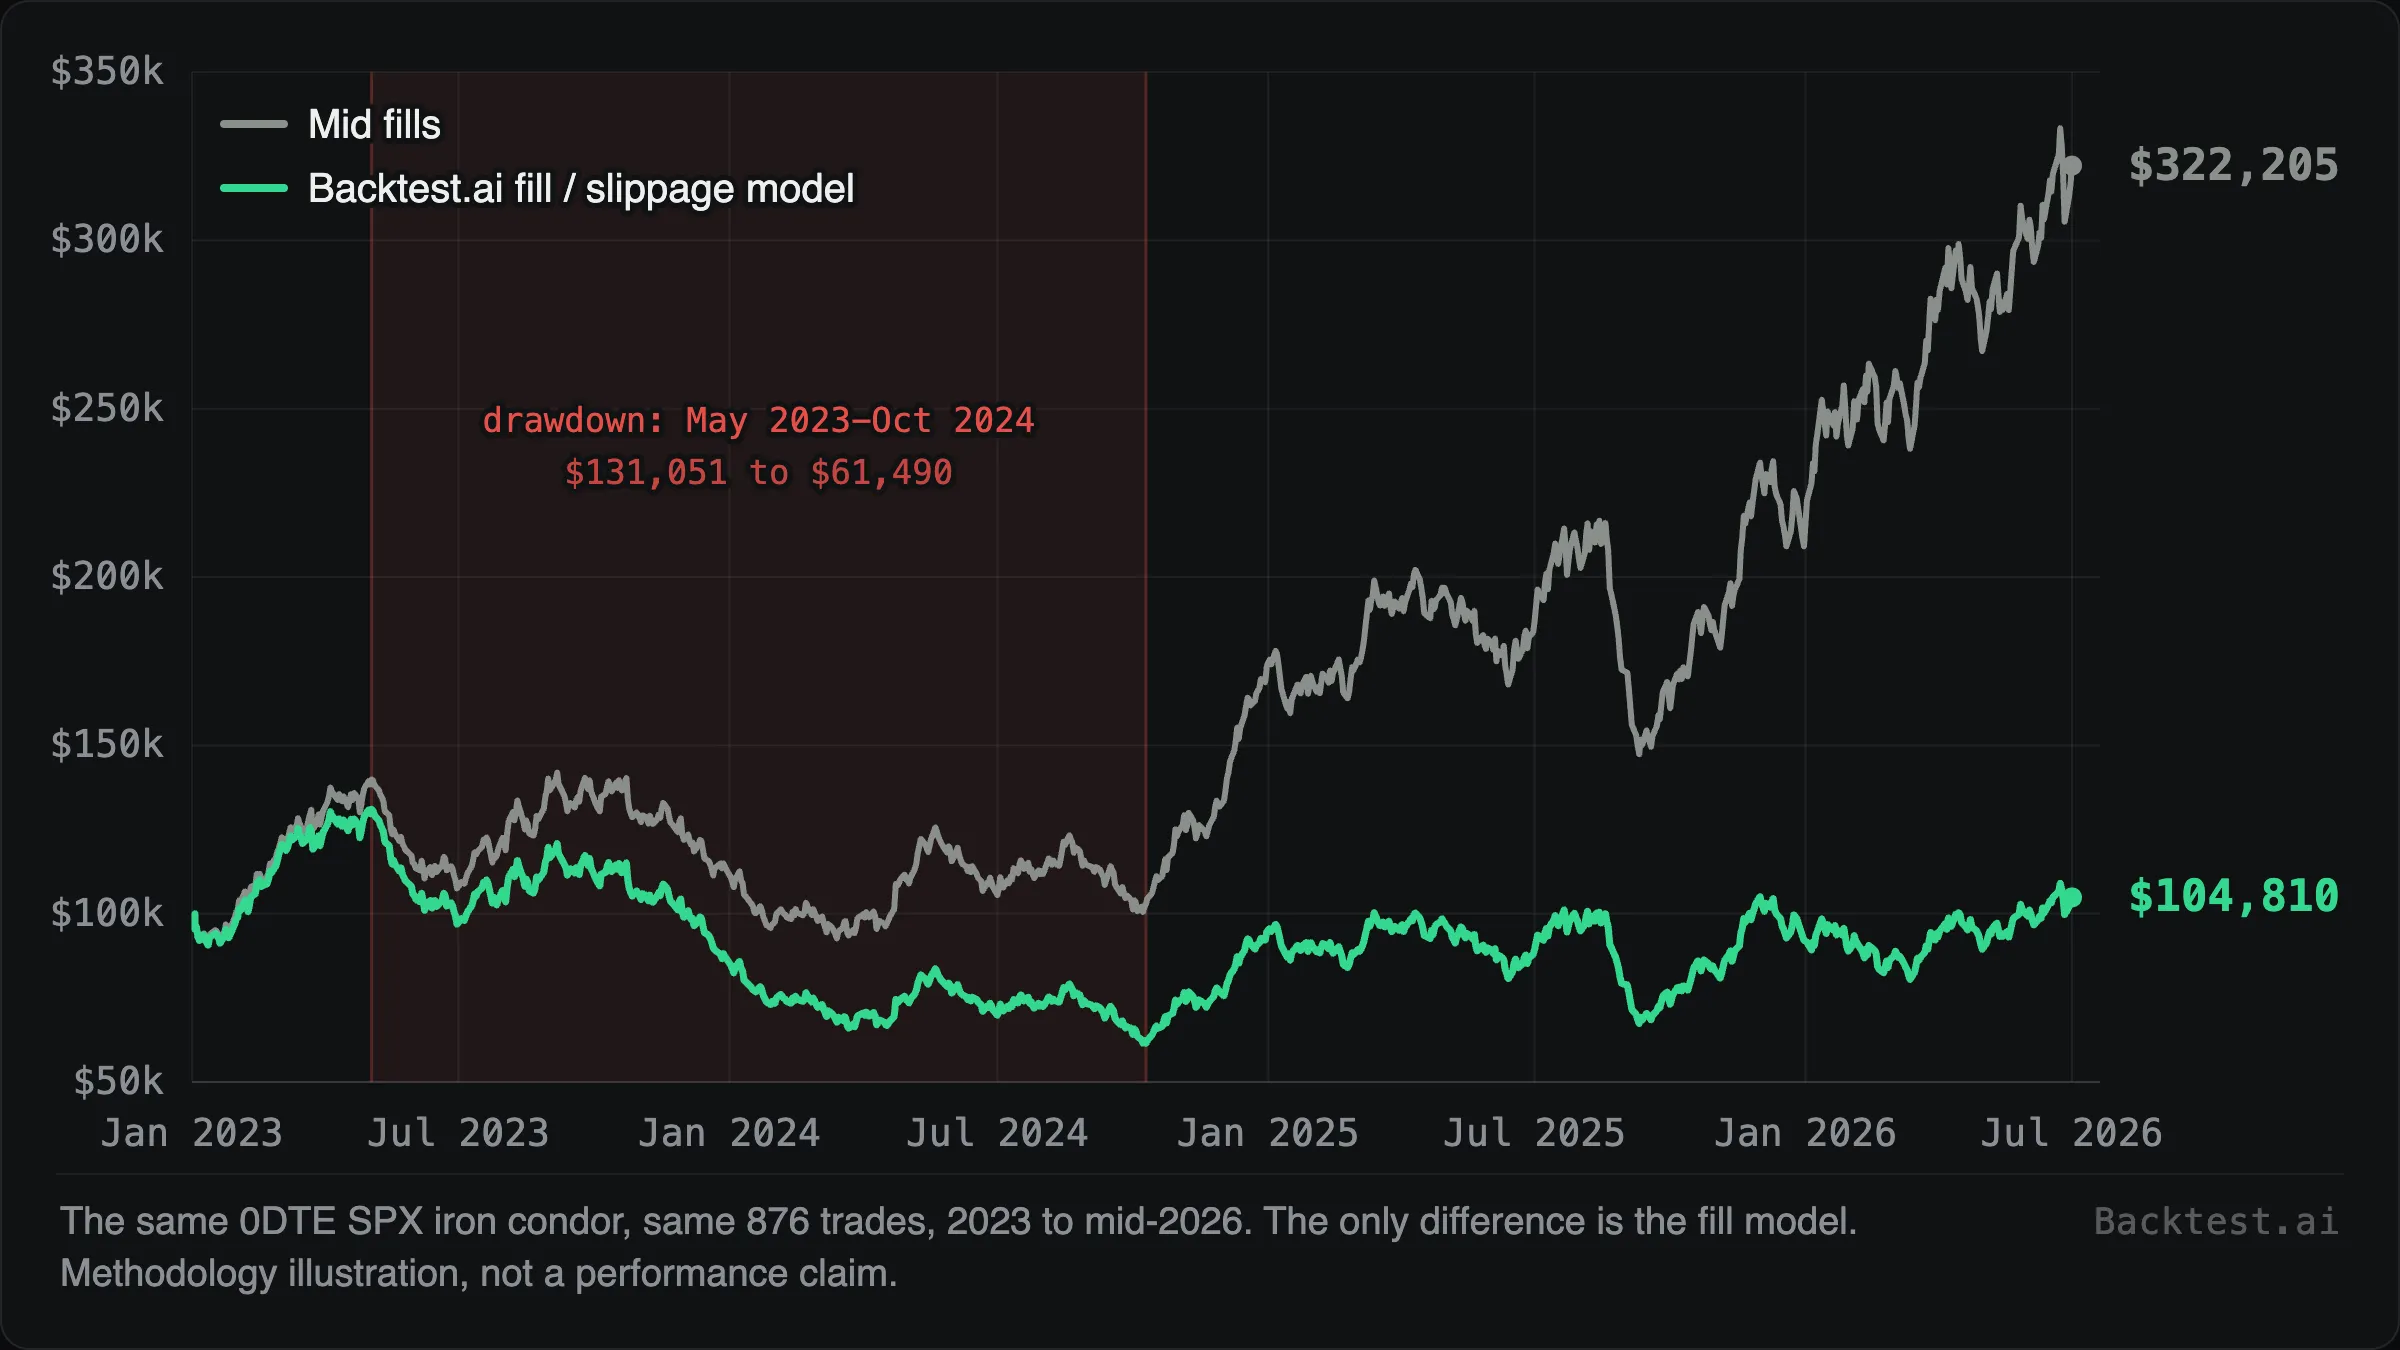
The mid-fill run's entire edge is $2.92 per spread. Realistic fills and fees take back $2.39 of it, on average, every trade. That's the whole story of the chart: an edge that mostly consisted of fills nobody gets. Twenty-two trades flip from winner to loser. And the realistic run is uglier as well as flatter, with the max drawdown deepening from 34.7% to 53.1% while the total return falls from 222% to 4.8%.
Scoring a backtest at mid is scoring your golf round with gimme putts. Every fill lands on the generous side of the spread, every single time, and the handicap that comes out is flattering and unrepeatable.
Two honest caveats. This condor holds for a median of two and a half hours, which makes it close to the worst case: when the edge per trade is a fraction of the bid-ask, fills are the entire game. A 45-DTE spread held for weeks pays the spread twice against a much larger expected move, so the bleed is proportionally smaller. But the direction never changes. Mid fills always inflate your edge, and the faster you trade, the more they inflate.
History depth: what the window can't see can't hurt the backtest
For this one we ran the put credit spread from above, the 25-delta, 10-wide, 30-DTE version, and deliberately gave both runs mid fills and zero costs. One variable moves: the years the backtest is allowed to see.
Tested on 2017 alone, it's the best strategy you've ever seen. 69 trades, 69 winners. Every spread expired at max profit, $100k compounded to $475k, and the worst drawdown along the way was -7.1%.
Tested on the full window, 2012 through July 2026, the same rules run out of money.
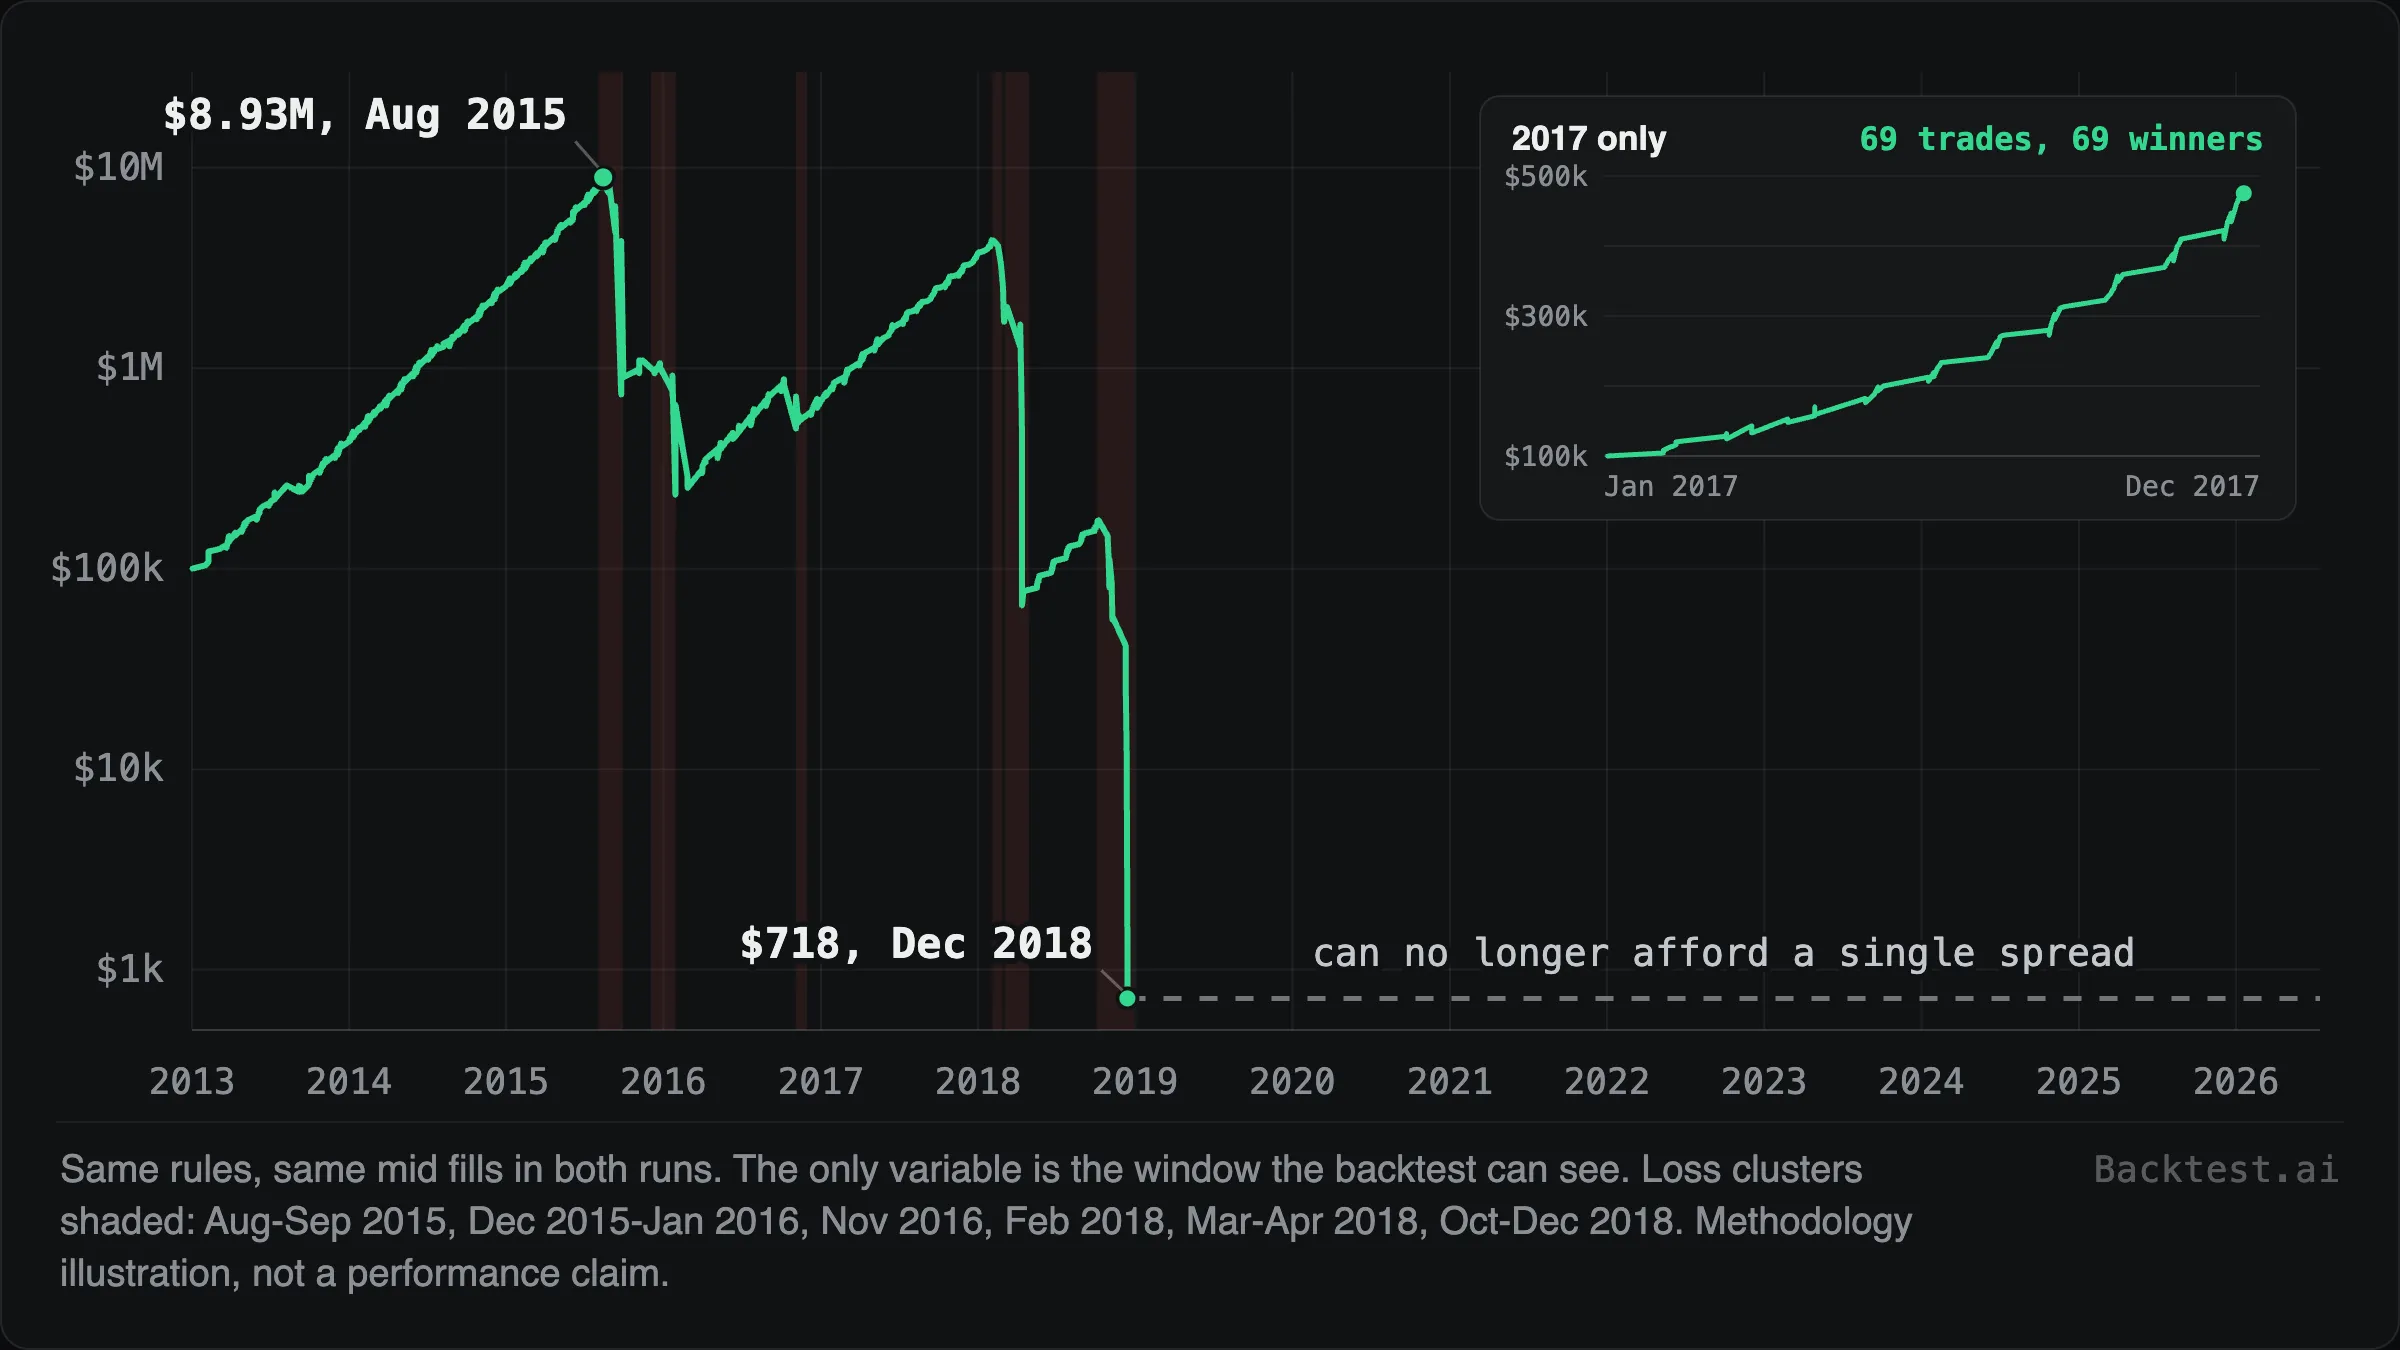
The long run still wins 89.8% of its 400 trades. It compounds $100k to $8.9 million by August 2015. Then the regimes the short window never met arrive: August 2015 hands it the three largest losses of the run, all opened within eight days, January 2016 follows, and 2018 lands three separate blows in February, March-April, and the fourth quarter. The account finishes 2018 at $718. The backtest doesn't end there, by the way. It keeps running for seven and a half more years. It just can't afford another trade.
Per spread, the arithmetic is blunt: the average winner made $164, the average loser lost $724. A 90% win rate with that ratio is a coin whose tails you meet every few years. [Yes, this run sizes aggressively, and gentler sizing survives longer. Change the sizing and the drawdowns shrink; the years that cause them don't move.]
Judging this strategy on 2017 is calling a goalie elite because no one took a shot. This is why data depth belongs on a backtester's spec sheet next to resolution: minute-level history back to 2012 exists so a multi-day strategy has to face 2015, 2016, 2018, 2020, and 2022 before you believe it. One caveat cuts the other way: nobody can run a 0DTE backtest to 2012, on any platform, because daily SPX expirations didn't exist yet. The full five-day 0DTE calendar only dates to May 2022 (rollout table in the FAQ below).
Margin: the constraint most backtests skip
Margin rarely changes whether a single trade wins. It changes how many contracts could have been on, which changes everything the equity curve claims.
Under Reg-T, a defined-risk spread ties up its width minus the credit. Naked short options tie up far more, by a formula keyed to the underlying's price. Portfolio margin is risk-based and can permit several times Reg-T's short premium in the same account. A backtester that lets you switch margin off will cheerfully size positions no broker would accept. If the engine can't tell you where the margin call would have landed, the equity curve is fan fiction with a Sharpe ratio.
How we compute fills and margin is documented in our methodology.
The biases that fool you
Three show up in options backtests specifically.
Look-ahead. Future information leaking into a past decision. The options-specific flavors are sneaky: marking positions against a volatility surface fitted with the full day's data, using end-of-day IV for an intraday decision, or settling an expiring SPX position the wrong way (AM versus PM settlement changes the print). More in look-ahead bias.
Survivorship. Backtest covered calls across "the S&P 500 members" and today's list quietly excludes every company that left it. Index products largely dodge this; single-name option universes don't (survivorship bias has the details).
Overfitting. Ten tunable parameters against 250 trades is memorization wearing a lab coat. The cure is step 4's discipline, plus fewer knobs than you want; overfitting covers why.
From a backtest you trust to a strategy you trade
More strategies die in the handoff than in the research. The usual failure: the backtest lives in one tool and execution lives in another, so the rules get re-implemented, and re-implementations drift. "The 25-delta strike" becomes "the nearest strike to 25 delta at my broker's quote time." An exit at 3:50 becomes an exit at 3:52. Each drift is small. The sum is a strategy you never tested.
Three principles keep the thing you trade equal to the thing you validated. Test and execute on the same engine. Freeze an immutable snapshot of exactly what passed validation, so later edits can't leak into a live strategy. Paper trade before capital, where paper means the live engine with the money unplugged rather than a second, different simulator. That research-to-live loop is what Backtest.ai is being built around.
Frequently asked questions
Can you backtest options strategies for free?
Within limits. End-of-day chain data and a spreadsheet can honestly test a slow, defined-risk strategy that never acts intraday. The catch: free data is usually EOD with short history, which reruns both experiments above in the wrong direction, generous fills plus a window that can't see the bad years. If you're weighing paid tools, our comparison of options backtesting software covers what each one actually models; if you'd rather build, start with backtesting options in Python.
Can you backtest options on thinkorswim or TradingView?
Not programmatically. thinkorswim's OnDemand is manual replay, one session at a time, with you clicking the trades (tested here). TradingView's Strategy Tester has no native options chains, so people approximate options strategies with the underlying's price series, which discards the spread, the greeks, and the expiration (details).
What data do you need to backtest options?
Historical chains with real bid and ask quotes, not just trades or mid prints. Minute cadence for anything intraday. Point-in-time event data (earnings dates as they were known then, not as revised later) if entries key off events.
How far back can you backtest 0DTE strategies?
Only as far as daily expirations existed. The SPX weekly rollout:
Five-days-a-week 0DTE data exists only from May 2022. A "ten-year 0DTE backtest" is mostly a backtest of Fridays.
Is a profitable backtest enough to start trading it?
No. Treat any backtest as an upper bound: the biases inflate it and the fill assumptions flatter it. Validate out-of-sample, walk it forward, paper trade it on live data, and only then decide what it's worth.
Both runs of that opening condor were accurate about the past. Only one was honest about it. The rules are the easy 20% of options backtesting; the other 80% is refusing to let your assumptions do the winning for you.

Research notes from Liam, building Backtest.ai: the methodology, the data, and the experiments behind the platform.
Keep reading
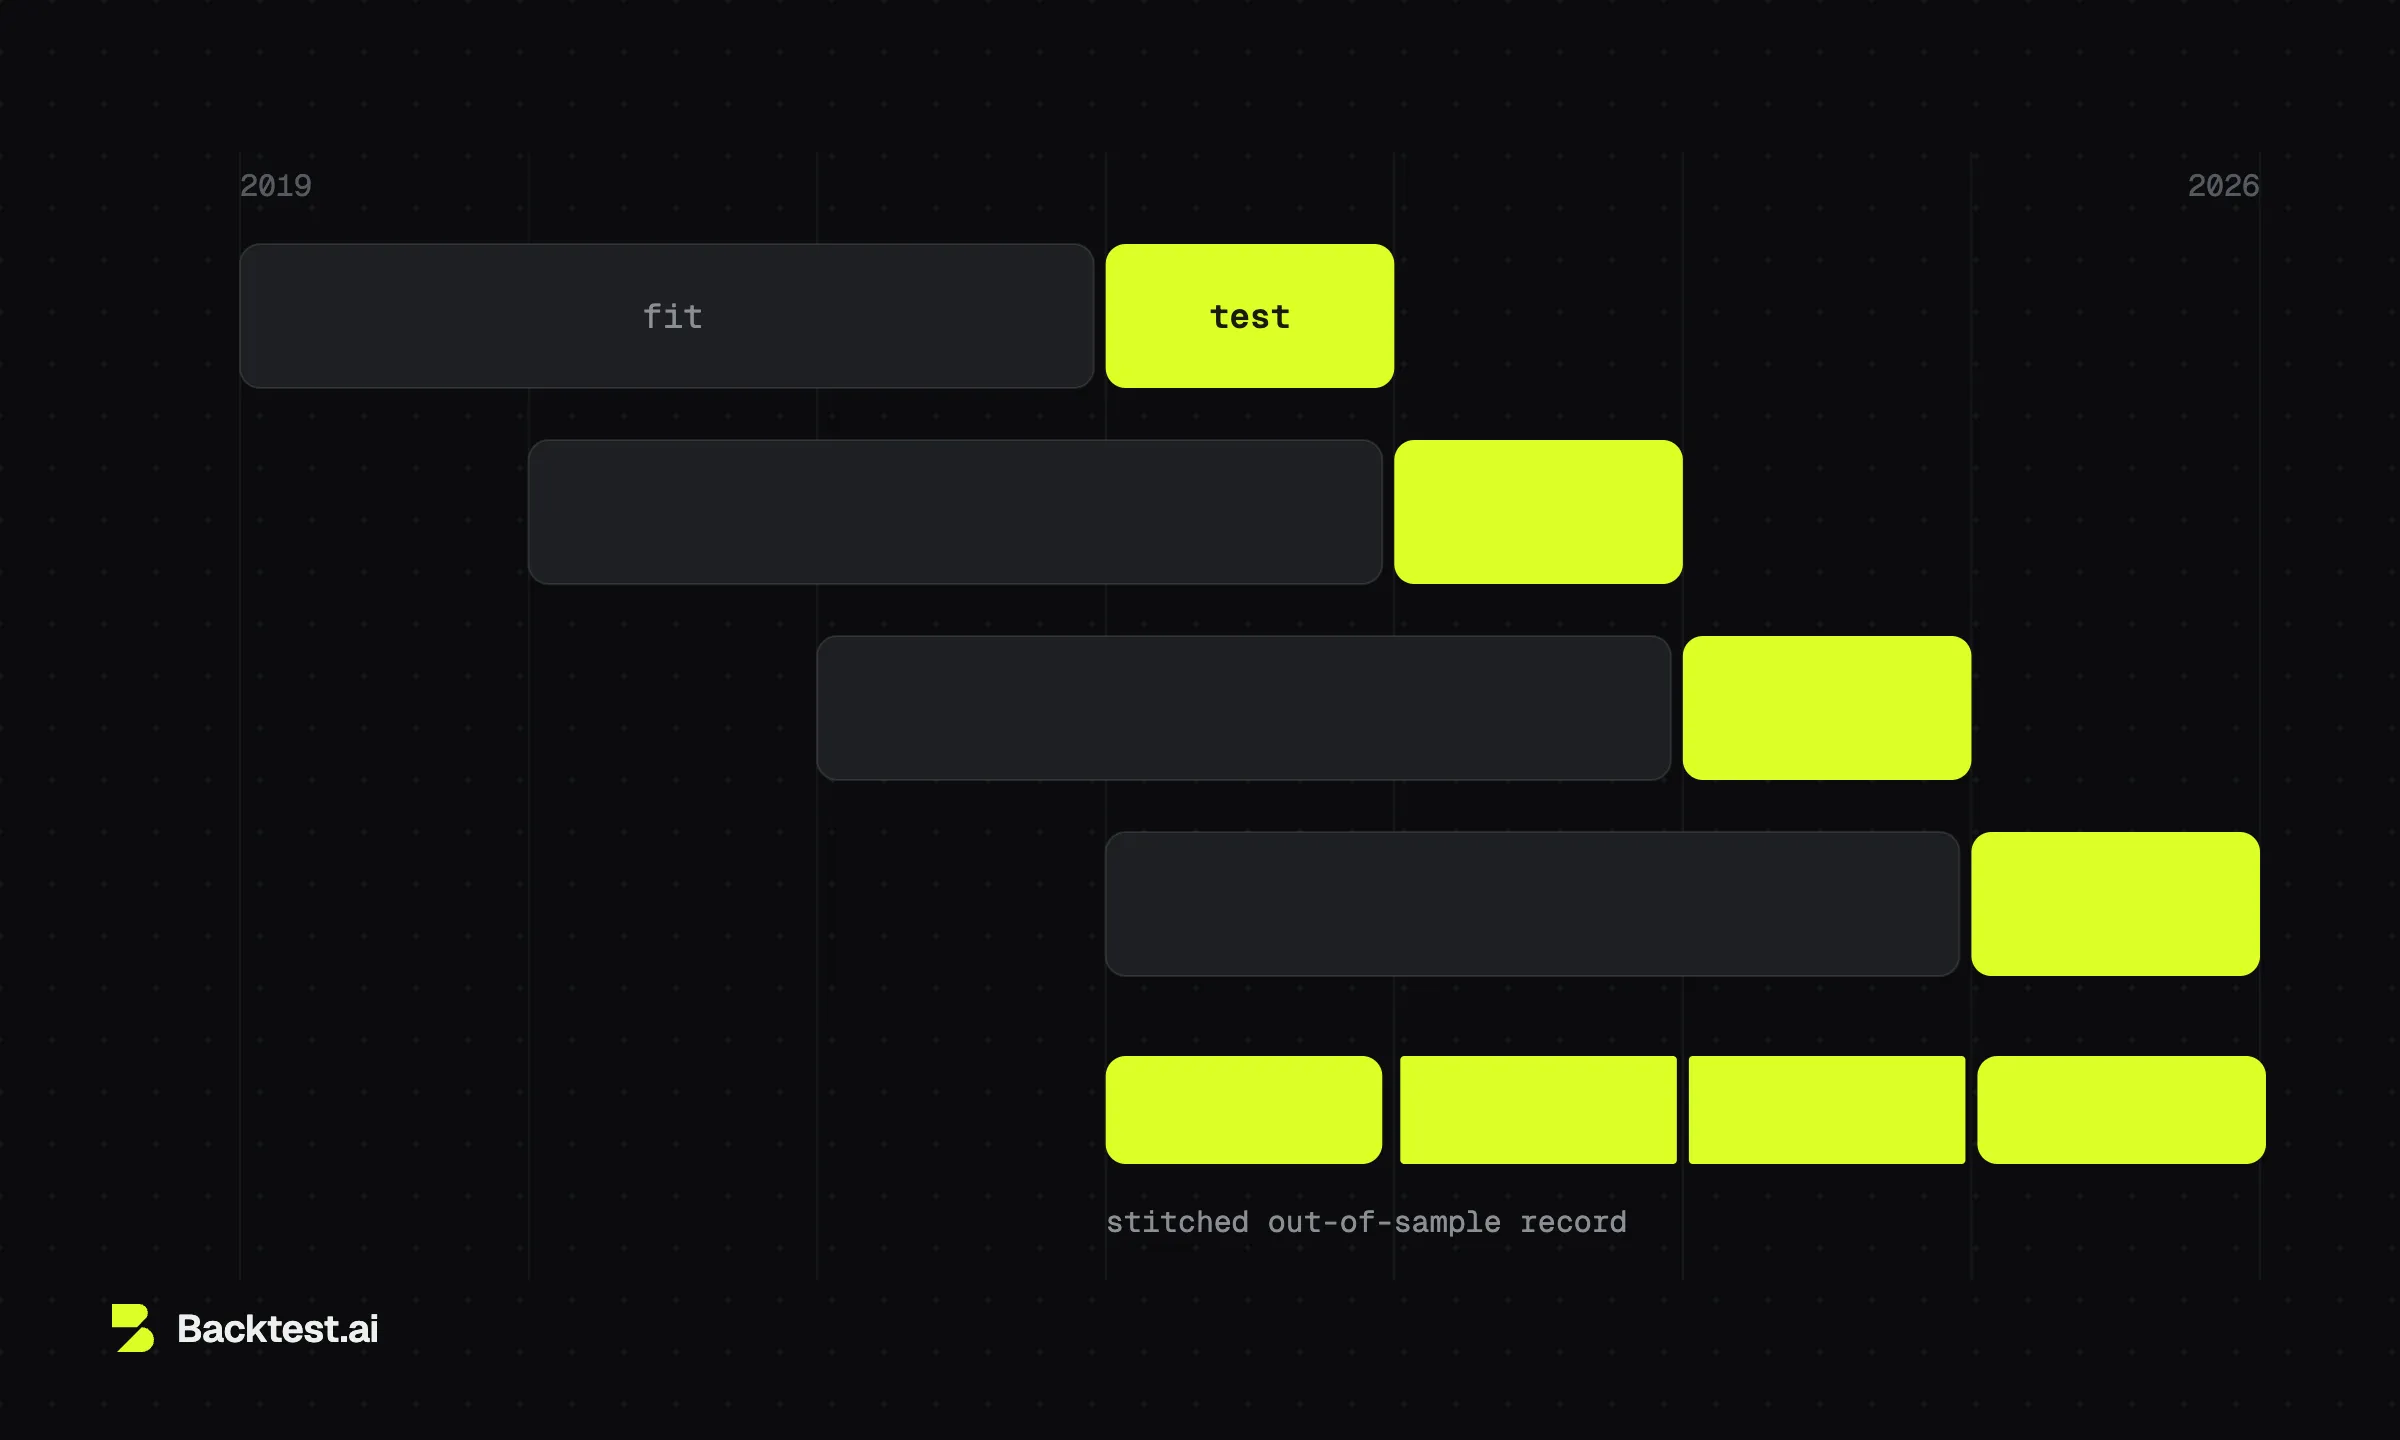
Walk-Forward Analysis: How to Validate and Optimize Trading Strategies
Fit on one window, test on the unseen window after it, roll forward. What walk-forward analysis buys you over a single train/test split, and how to read a real fold table — including one that failed.
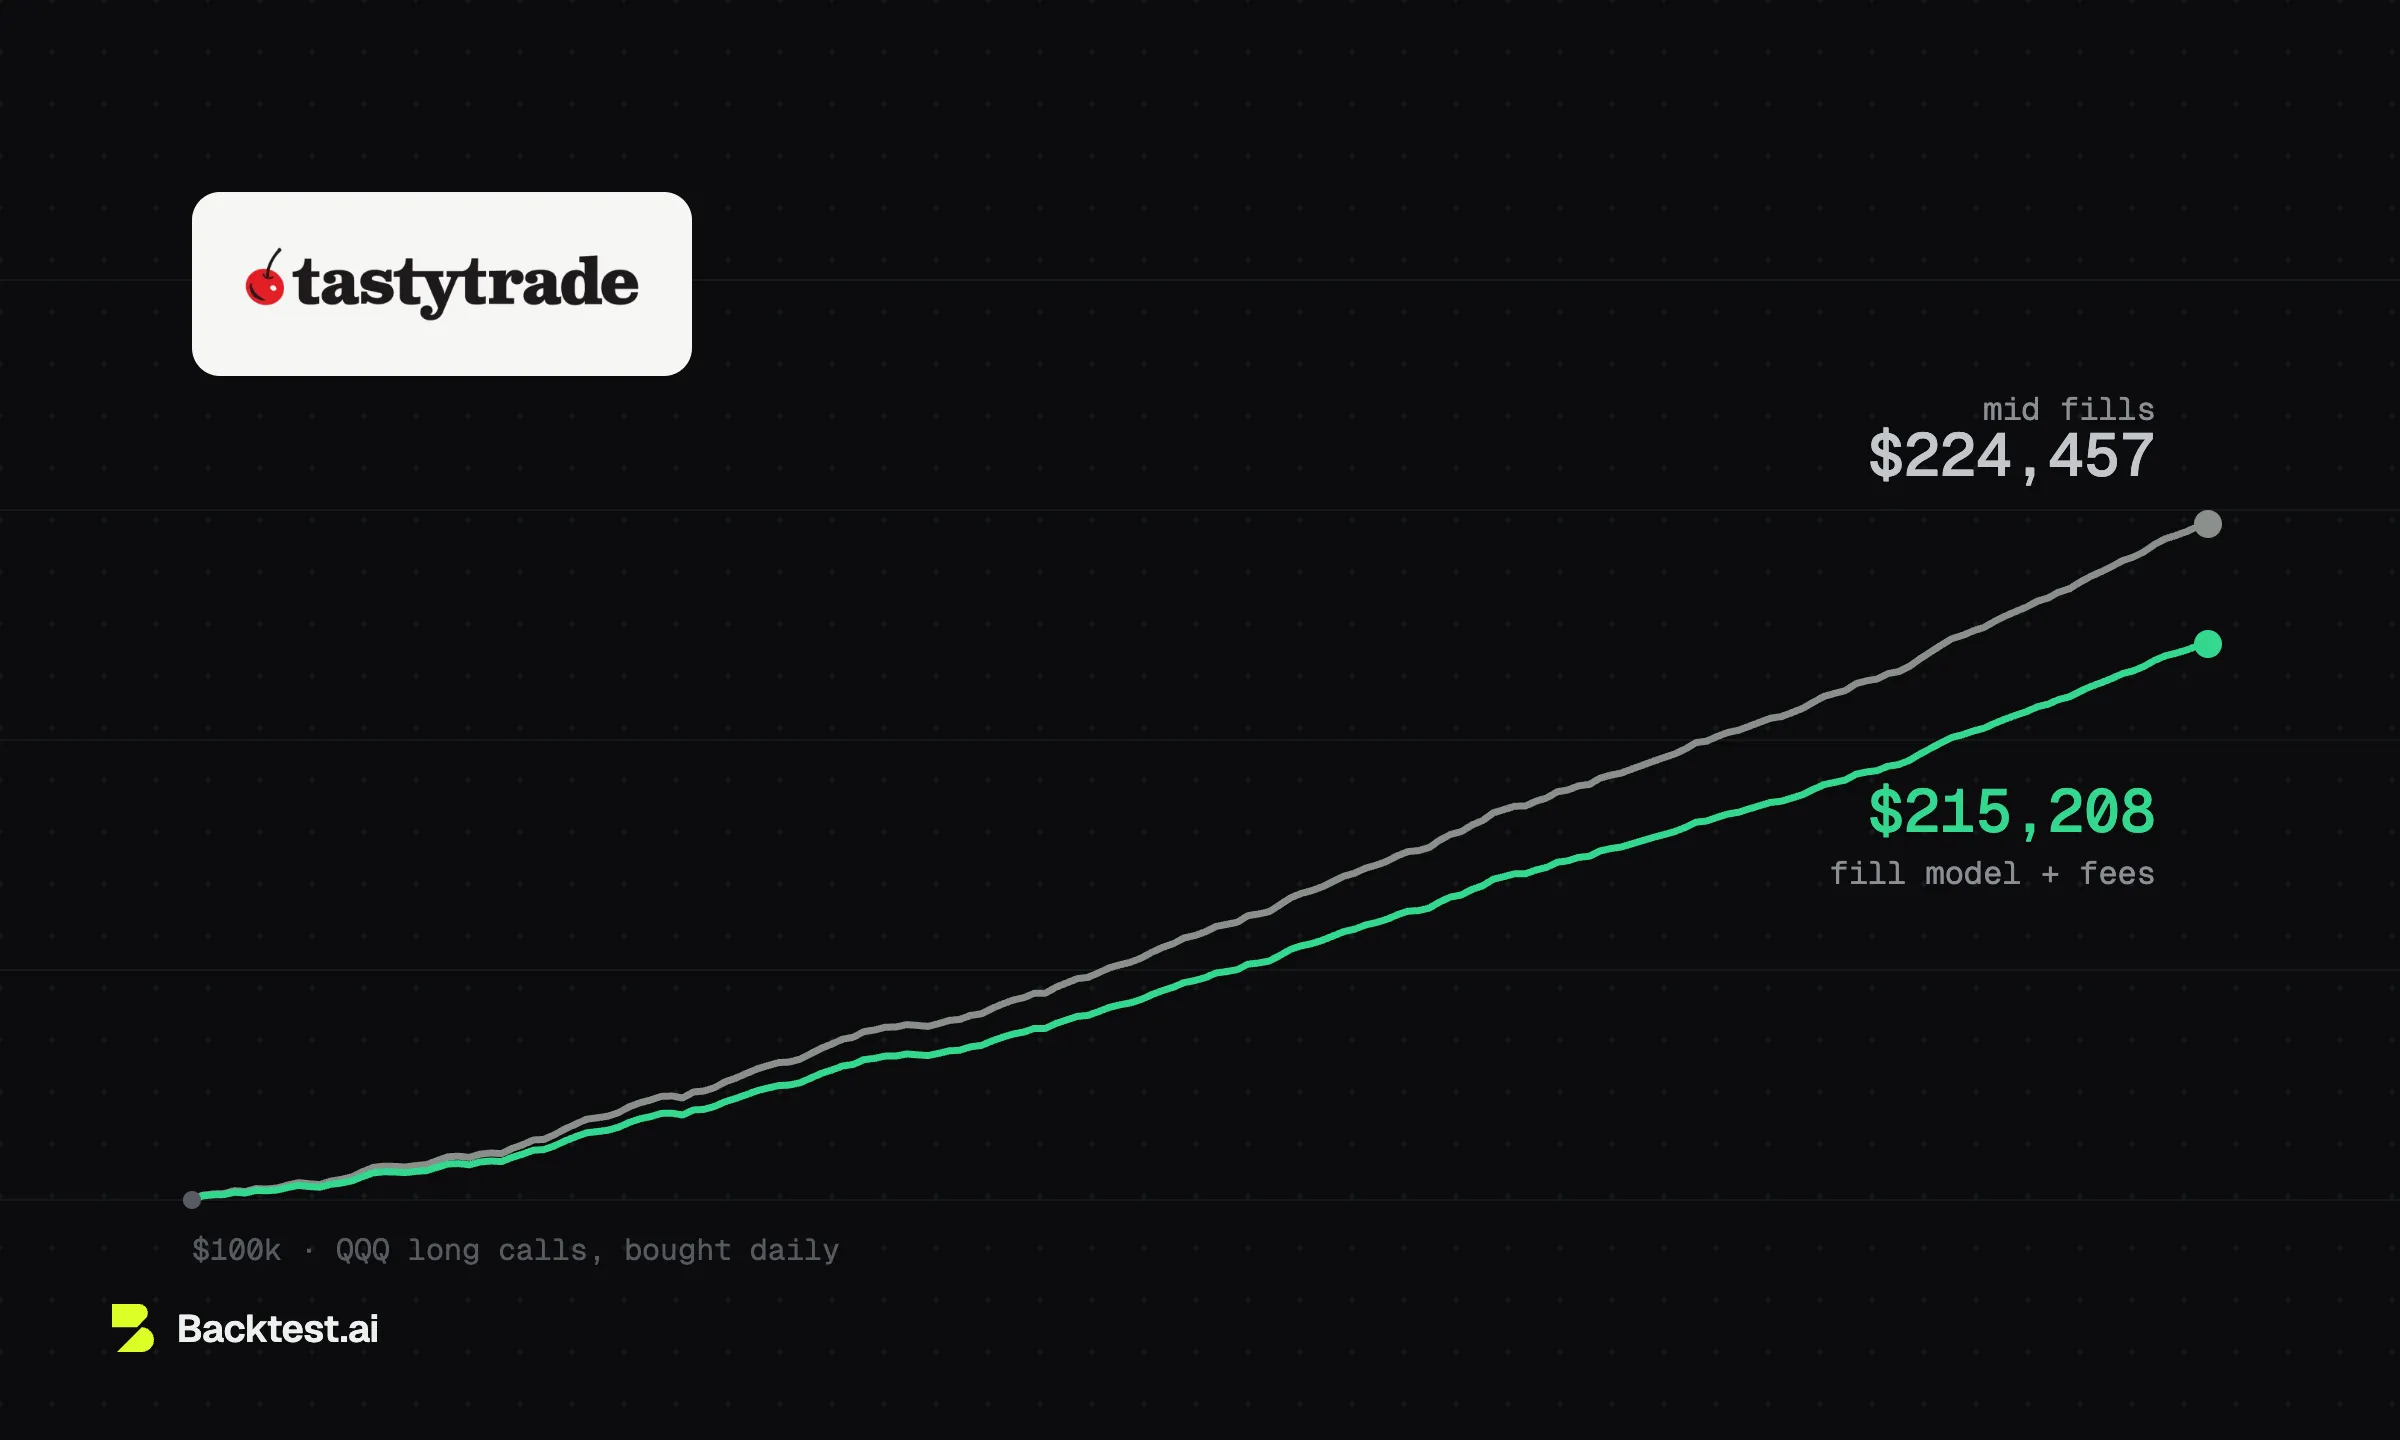
tastytrade Backtesting, Tested: What It Does and Where It Breaks
We tested tastytrade's free backtester: a fine first pass on whether a structure makes sense, blind to anything intraday. What it does, where it breaks, and the same backtest rerun with modeled fills.