Walk-Forward Analysis: How to Validate and Optimize Trading Strategies
Fit on one window, test on the unseen window after it, roll forward. What walk-forward analysis buys you over a single train/test split, and how to read a real fold table — including one that failed.
What walk-forward analysis is
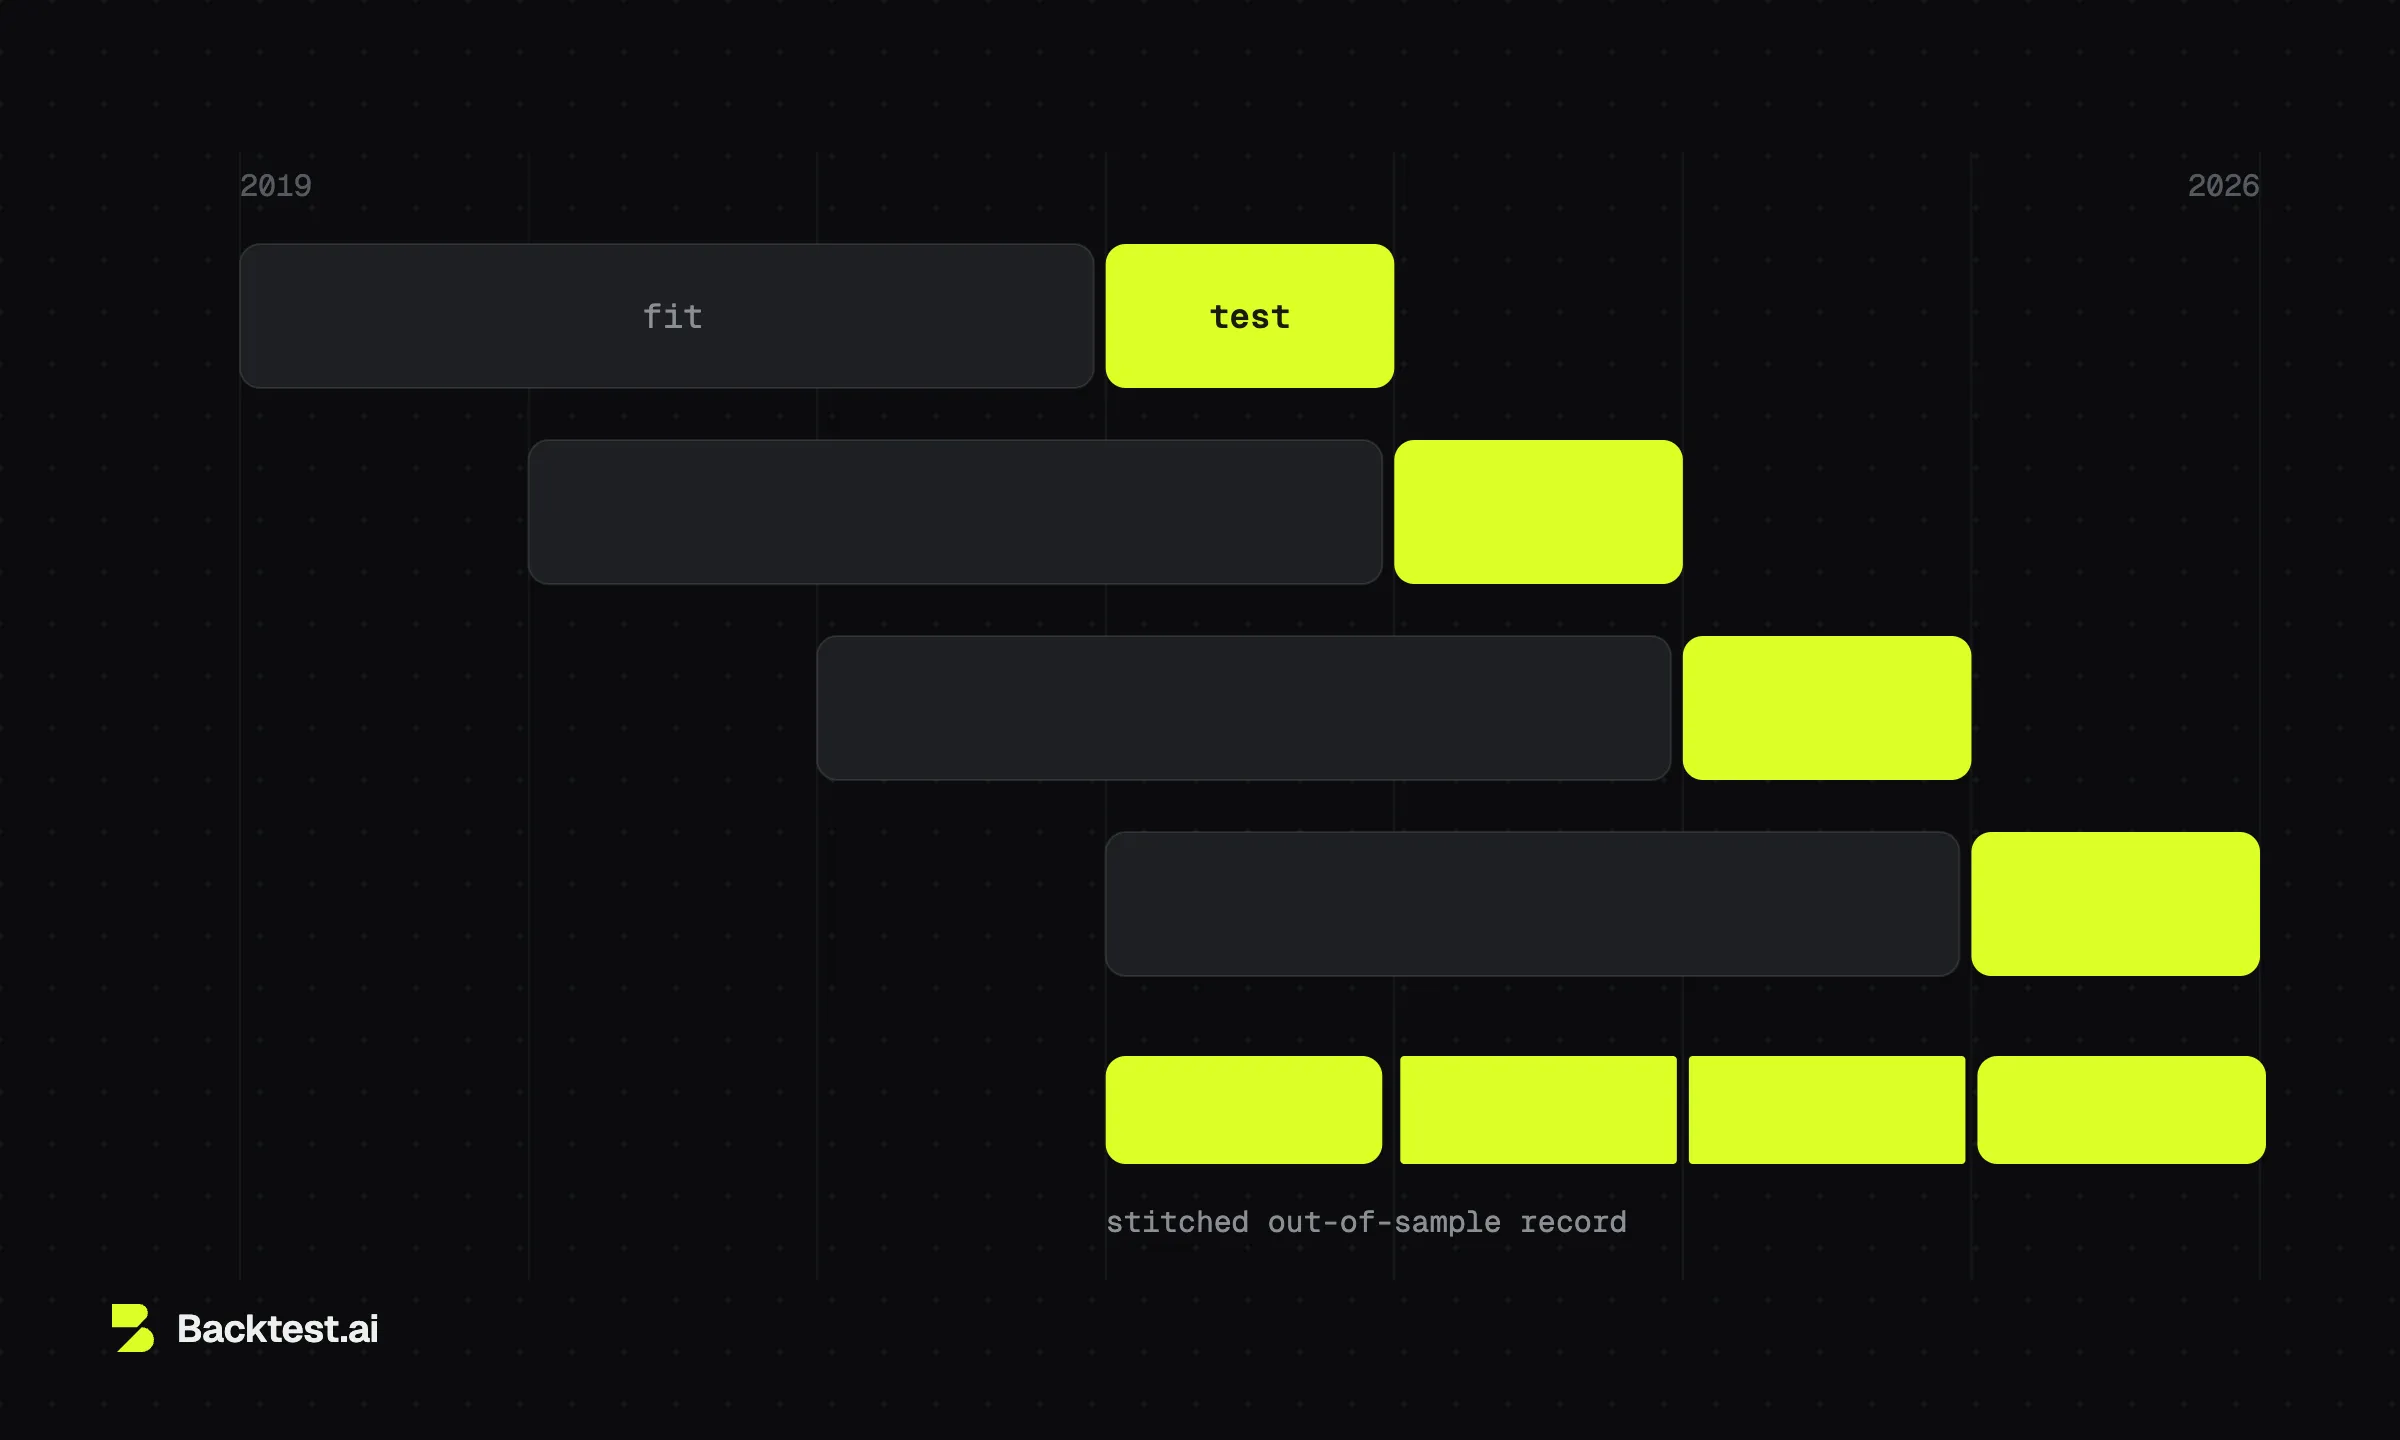
Walk-forward analysis, also called walk-forward validation, tests a trading strategy by fitting its parameters on one window of history, measuring the result on the unseen window immediately after it, then rolling both windows forward and repeating. The out-of-sample segments are stitched into a single record, and the strategy is judged on that record only, never on the fitted windows.
That's the whole mechanism. What it buys you is repetition: instead of one verdict from one held-out slice, you get a verdict per fold, spread across regimes, each earned on data the fit never touched. It also quietly tests two things at once, the strategy and the rule you used to re-fit it. Most of this page is about reading what it hands back, because that's the part every explainer skips.

Why a single train/test split isn't enough
The standard advice is to hold out the last stretch of history and test there. It fails in two ways.
One test window is one draw of a noisy variable. Edge per trade swings year to year for reasons that have nothing to do with the strategy [the fold table below runs from -$75 to +$62 per spread across four consecutive years]. Judge on a single slice and you're grading whichever draw you happened to reserve.
The second failure is quieter. A hold-out only stays out-of-sample once. The first time it disappoints, you go back, tweak, and test again, and after a few rounds you've optimized on the test set with extra steps. Retake the same practice exam until you pass and you've memorized an answer key; the exam stopped measuring anything the first time you saw it.
Walk-forward fixes both by construction: many test windows instead of one, and every test block sits strictly after the block that trained it.
How it works: rolling in-sample and out-of-sample windows
A walk-forward analysis repeats the same six-step process:
- Select an in-sample window. Choose the historical period used to fit or optimize the strategy.
- Fit the strategy. Test the permitted parameter values on that in-sample window and select them using a rule defined in advance.
- Lock the selected parameters. Once the fit is complete, do not change the strategy based on what happens in the next window.
- Test on the immediately following out-of-sample window. Record only the performance produced on this unseen data.
- Roll both windows forward and repeat. Refit the strategy using the next in-sample window, then test it on the next out-of-sample window.
- Stitch the out-of-sample results together. When history runs out, combine the recorded test segments into one continuous out-of-sample record and evaluate the strategy on that record.
There are two common window styles.
Rolling: The training window keeps a fixed length and slides forward. A three-year window fit in 2025 has completely forgotten 2020. Each fit sees less data than an expanding window, but the fix is a dial you already own: if the fits come out too noisy, lengthen the window.
Anchored, or expanding: The training start stays pinned and the window grows as it steps forward. This provides more data per fit, but 2015 never ages out and continues influencing parameters intended for a 2025 market. The anchor is also another parameter: anchor at 2012 instead of 2015 and every downstream fit changes. The entire result can therefore become sensitive to a start date chosen because of data availability rather than a defensible argument.
Rolling is the better default because it introduces one fewer arbitrary choice. Whichever method you use, choose it in advance. Run both and publish the prettier result, and the window style has become one more fitted parameter.

How to read a fold table
Here is a real one, so the lesson has something to read.
The strategy: an SPX put credit spread, 10 points wide, 10 DTE, one contract per trade, entered daily and held to expiration. The short leg's delta is the parameter being fit, over the grid 15, 20, 25, 30, 35. The design: three years in-sample, one year out, rolling, stepped one year, four folds covering 2019 through 2025, fills and fees modeled in every fold. Each fold picks the delta with the best in-sample edge per spread, then gets judged on the year it never saw.
Every walk-forward run tests a hypothesis whether you state it or not, so state this one. It postulates that the delta which earned the most per spread over the trailing three years is the right delta for the next year. Why should that be true? Calm years crown the most aggressive delta just in time for the tail; scarred years crown the most defensive one just in time for the recovery. A trailing window can be a machine for arriving at each regime dressed for the one that just ended.
The table gets to say whether it was true here.
Per-fold parameter choice and in-sample versus out-of-sample edge per spread, from runs on the Backtest.ai engine. Methodology artifact, not a performance claim.
Read it in three passes.
Parameter stability. The chosen delta went 35, 15, 15, 35. That's a fit chasing regimes, not converging on anything. And look at what it was choosing from: in folds 2 and 4, every delta on the grid lost money in-sample, so the "optimal" parameter was the least bad of five losers. An optimizer always hands you a winner. It never volunteers that the contest was between losers.
The plateau, or its absence. The full in-sample grid is where you check whether neighboring parameters agree:
In-sample edge per spread across the delta grid; bold marks each fold's pick. Methodology artifact, not a performance claim.
Fold 1 at least agrees with itself: edge rises smoothly from $30 at 15-delta to $52 at 35, every neighbor confirming the direction. That's monotonicity, the first thing you'd check in a trading signal, and the shape of something real in that window; whether it persists is the next column's problem (2022 answered). Fold 3 is the other shape: +$9 at 15-delta, -$4 at 20, +$7 at 25. When adjacent strikes disagree on sign, you're reading noise with a ruler. A parameter whose neighbors also work is a finding. A spike whose neighbors don't is a fit.
The degradation column. Fold 1 is the overfitting fingerprint in one row: the most confident fit of the four, +$52 in-sample, delivered -$75 out-of-sample, a $127-per-spread swing, landing in 2022, the exact regime a delta fitted on 2019 through 2021 was dressed wrong for. The column's other direction matters just as much: folds 2 through 4 beat their fits by $13, $10, and $63. One fold beating its fit is no more a vindication than one fold missing is a verdict, and four folds is a small pattern.
What the table does establish: these in-sample fits never had anything stable to find. That instability is precisely what a single full-window optimization hides. Fit delta once over all of 2019 through 2025 and you get one number and one tidy curve, with all four of these rows compressed invisibly inside it.
On tooling: Backtest.ai builds walk-forward validation into its model layer, where models trained on rolling windows report fold tables, coefficient stability, and an out-of-sample scatter, judged only on data they never saw. Most popular options backtesters have no walk-forward construct at all; the usual substitute is re-running configurations by hand and keeping the curve you like, which is the practice-exam loop with a nicer interface.
Walk-Forward Analysis vs Optimization, Validation, and Cross-Validation
Three terms that get used interchangeably and shouldn't be.
Out-of-sample testing is the principle: measure on data the fit never saw. A single hold-out is its one-shot form.
Walk-forward analysis is the repeated, time-ordered form: many hold-outs, each strictly after its training block, stitched into one record.
K-fold cross-validation, the machine-learning default, ignores time order. Each test fold sits with training folds before and after it, so the model learns from the future it's then scored on, and contiguous unshuffled blocks leak the same way. Purged and embargoed variants repair a finer leak at the fold boundaries, dropping training rows whose outcome windows overlap the test fold plus a buffer just after it.
Walk-forward dodges the ordering problem by construction, but that boundary detail still applies to it: a 10-DTE trade entered in the last week of a fit window settles inside the test window. The clean fix is a gap between windows equal to the strategy's longest holding period.
The deep treatments live on the out-of-sample testing page and the overfitting page.
Where walk-forward still misleads
It's the strongest validation habit available to a systematic retail trader, and there are still five ways to fool yourself with it.
You chose the design. Window lengths, step, refit cadence, rolling versus anchored: all hyperparameters. Try enough walk-forward configurations and keep the prettiest stitched curve, and you've rebuilt the exact bias the method exists to kill, one level up. Decide the design in advance and log what you tried.
It's one path of history. Every fold is cut from the single sequence that happened. Cutting a season's game tape into more clips gives you more clips, not more seasons. A regime history never served up is a regime no fold rehearsed.
Few folds, noisy verdict. Four folds was enough to expose an unstable parameter above. It's nowhere near enough to estimate an edge with confidence, and short out-of-sample windows make each fold's number high-variance on its own.
Fills flatter every fold in the same direction. Walk-forward validates the fitting process. It says nothing about whether the fills were real, and a walk-forward-clean strategy on mid-price fills is fiction that generalizes. How we model fills and margin is in our methodology.
The data's sins are inherited. Survivorship and look-ahead baked into the dataset pass through every fold untouched. Walk-forward reuses your data. It does not clean it.
The general foundations, from data windows to fill models, are covered in backtesting and in our options backtesting guide.
FAQ
Is walk-forward analysis the same as walk-forward optimization?
Same loop, two halves. Walk-forward optimization names the fitting half, picking parameters per window. Walk-forward analysis names the judging half, reading the stitched out-of-sample record. Honest use does both, which is why the terms travel together (walk-forward testing and walk-forward backtesting are further aliases).
How many folds do you need?
No magic number. Enough trades per fold that each fold's number means something, and enough folds to span more than one regime. The four folds above, at 186 to 247 trades each, were enough to expose parameter instability and not enough to estimate edge precisely. More history buys both.
Is walk-forward analysis the same as out-of-sample testing?
It's the repeated form of it. A single hold-out produces one out-of-sample estimate; walk-forward produces one per fold, each strictly after its training data, then stitches them into a record long enough to read.
Does walk-forward analysis prevent overfitting?
It detects it and shrinks the room for it. The in-sample-to-out-of-sample gap is the overfitting measurement, and judging only on unseen data removes the easiest way to fool yourself. Prevention is out of reach: shop walk-forward designs until one flatters and you're overfitting again, one level up.
The fold table above didn't validate the strategy, and that was the method working. Bad news at simulation prices is what walk-forward analysis is for; every other venue for that lesson charges more.
Educational content about backtesting methodology. The fold tables and figures above illustrate how a validation method behaves under different modeling assumptions; they are not performance claims, projections, or investment advice.

Research notes from Liam, building Backtest.ai: the methodology, the data, and the experiments behind the platform.
Keep reading
Options Backtesting: A Practical Guide for Systematic Traders
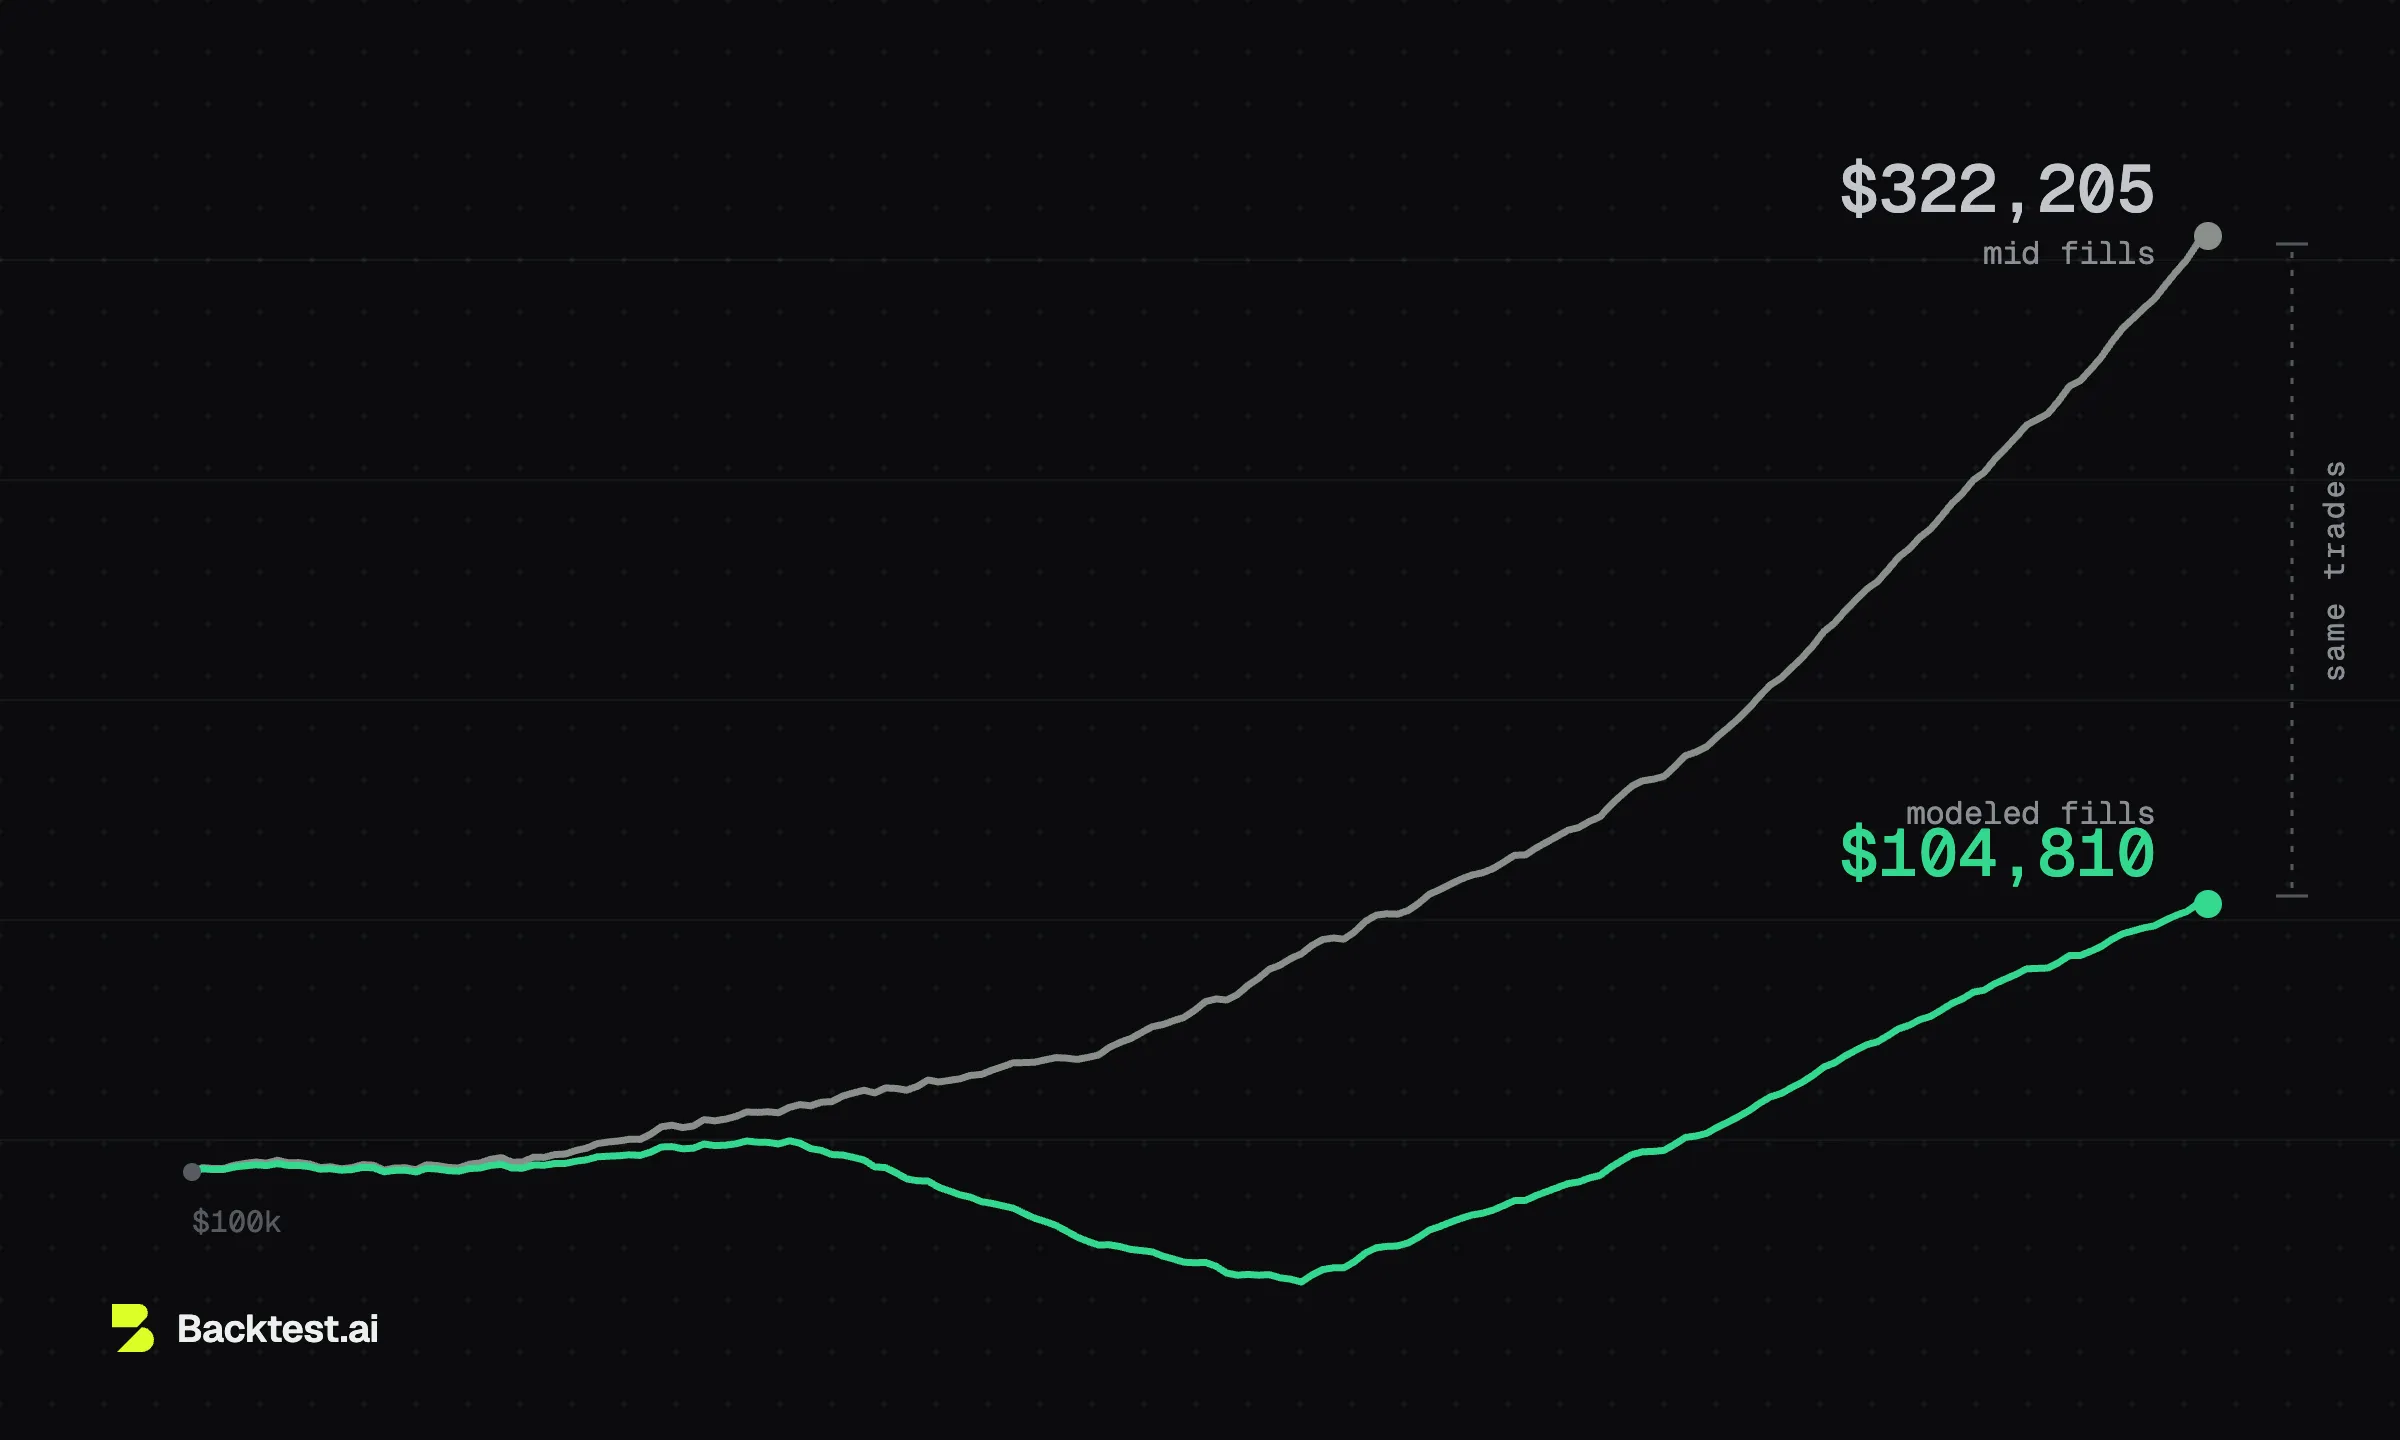
The same 0DTE iron condor, backtested twice: +222% with mid fills, +4.8% through a calibrated fill model. How to run an options backtest that doesn't flatter you — data, fills, margin, and validation.
tastytrade Backtesting, Tested: What It Does and Where It Breaks
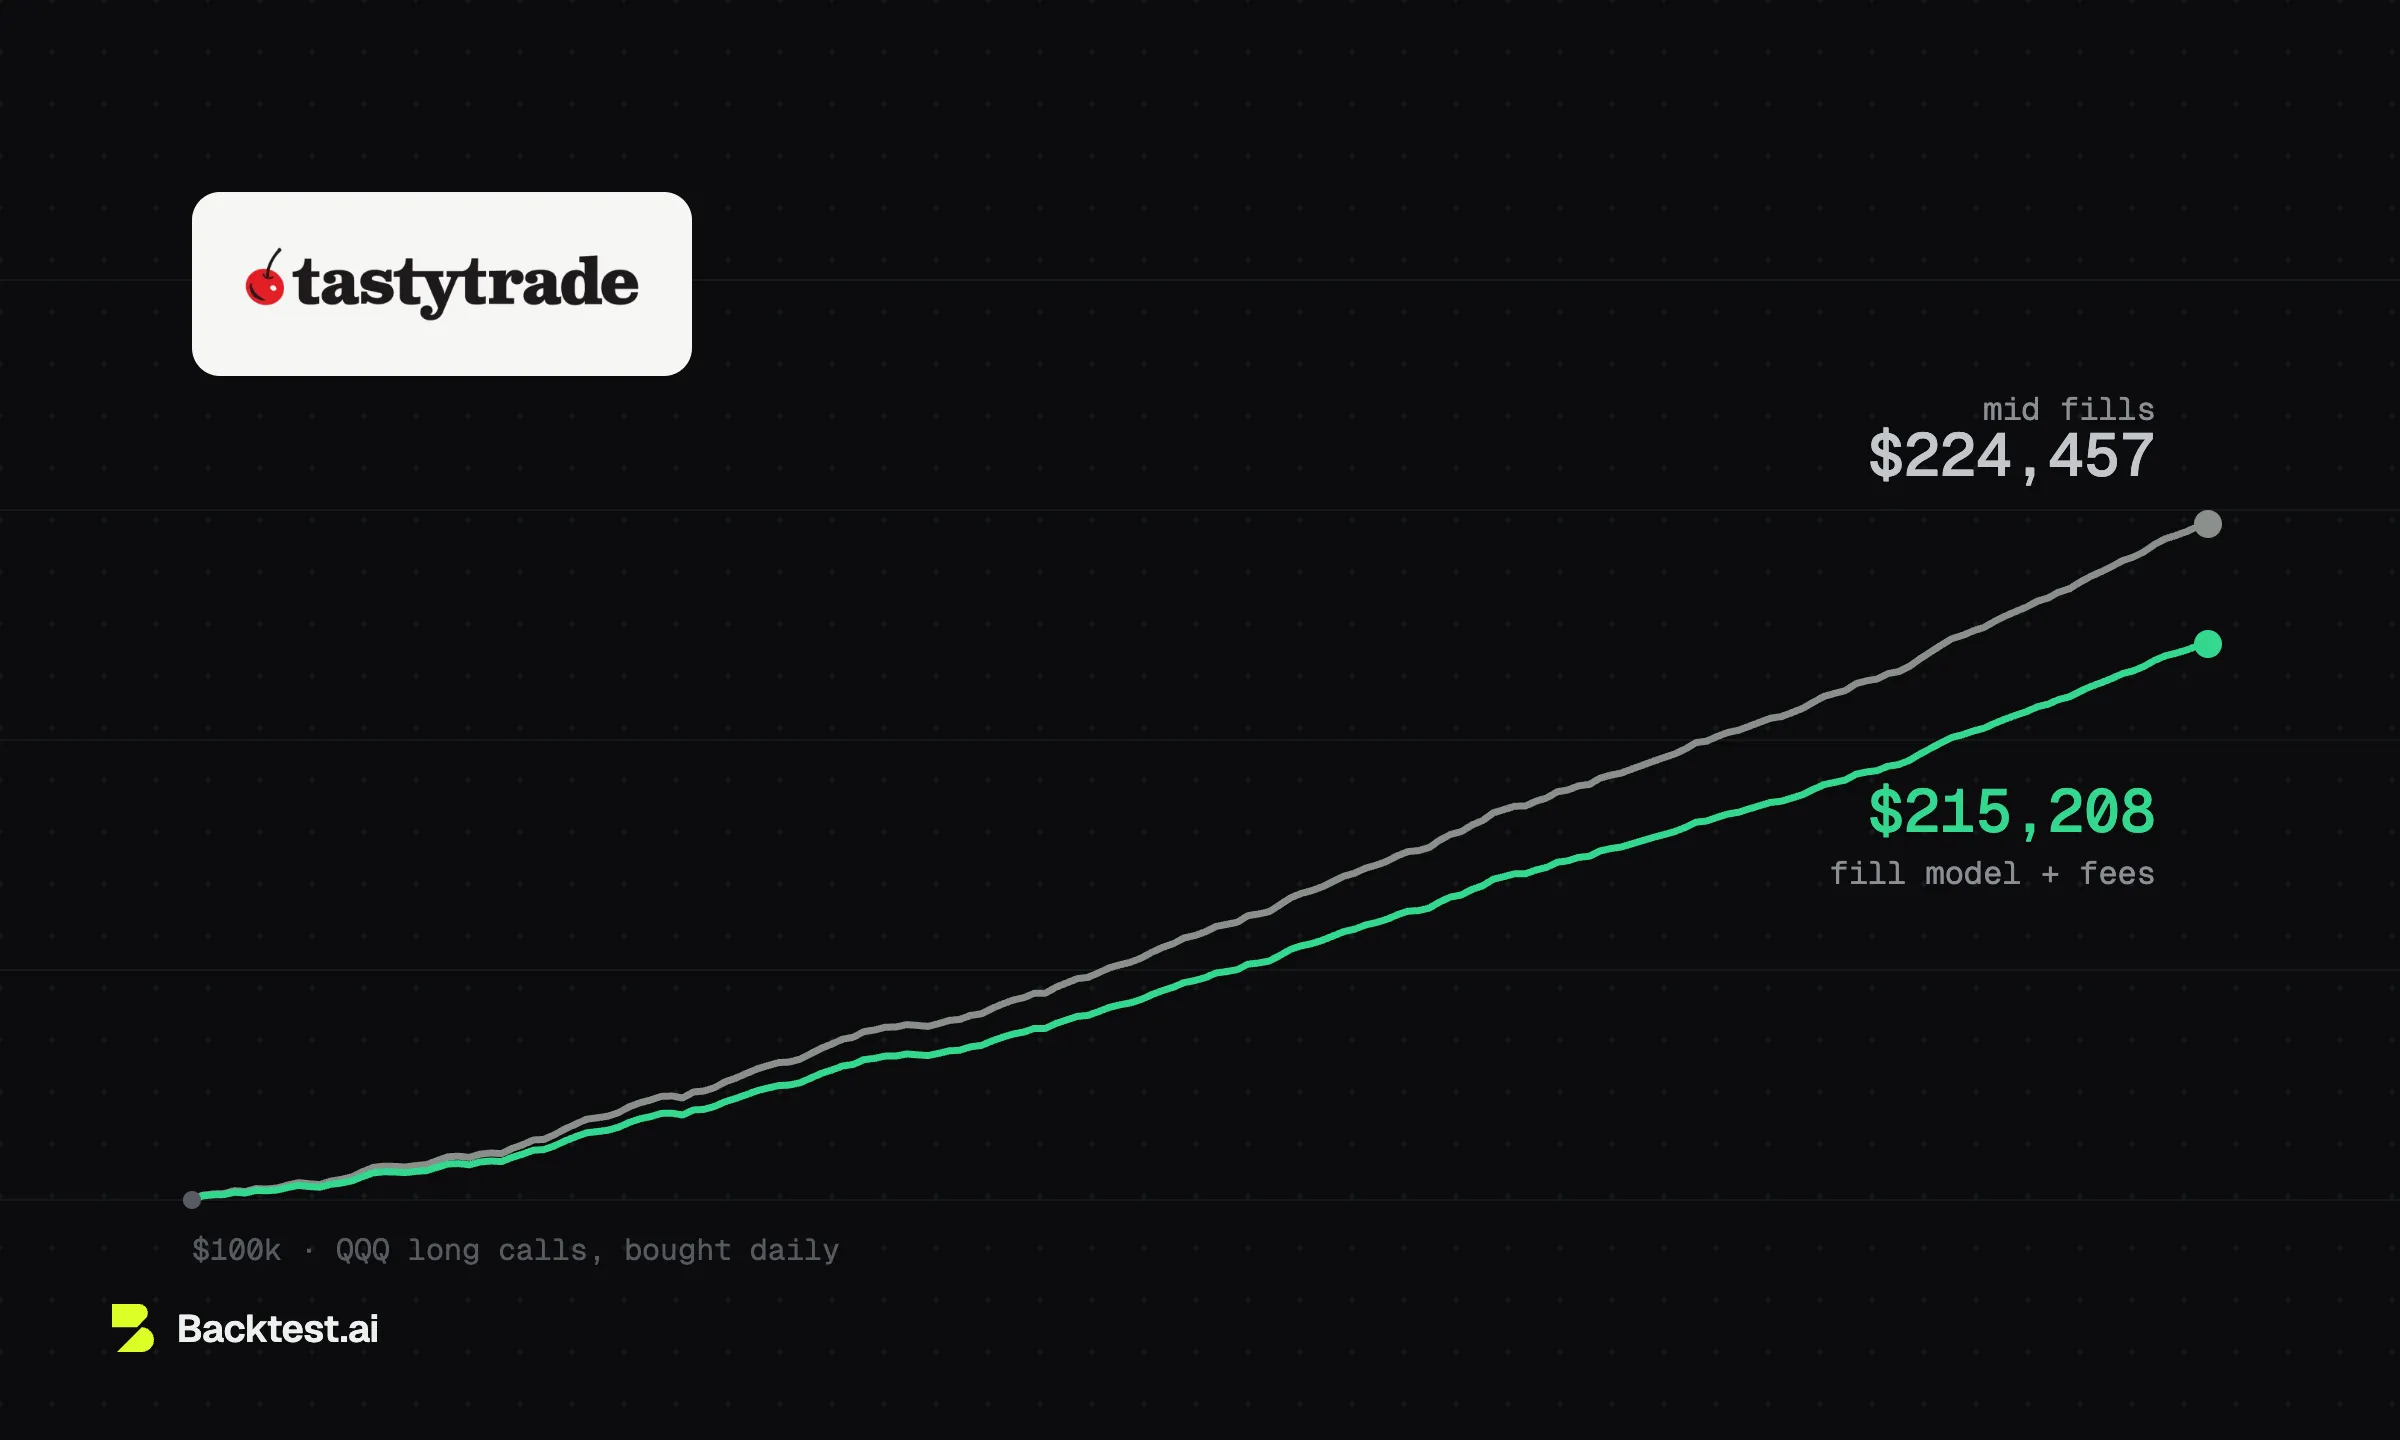
We tested tastytrade's free backtester: a fine first pass on whether a structure makes sense, blind to anything intraday. What it does, where it breaks, and the same backtest rerun with modeled fills.